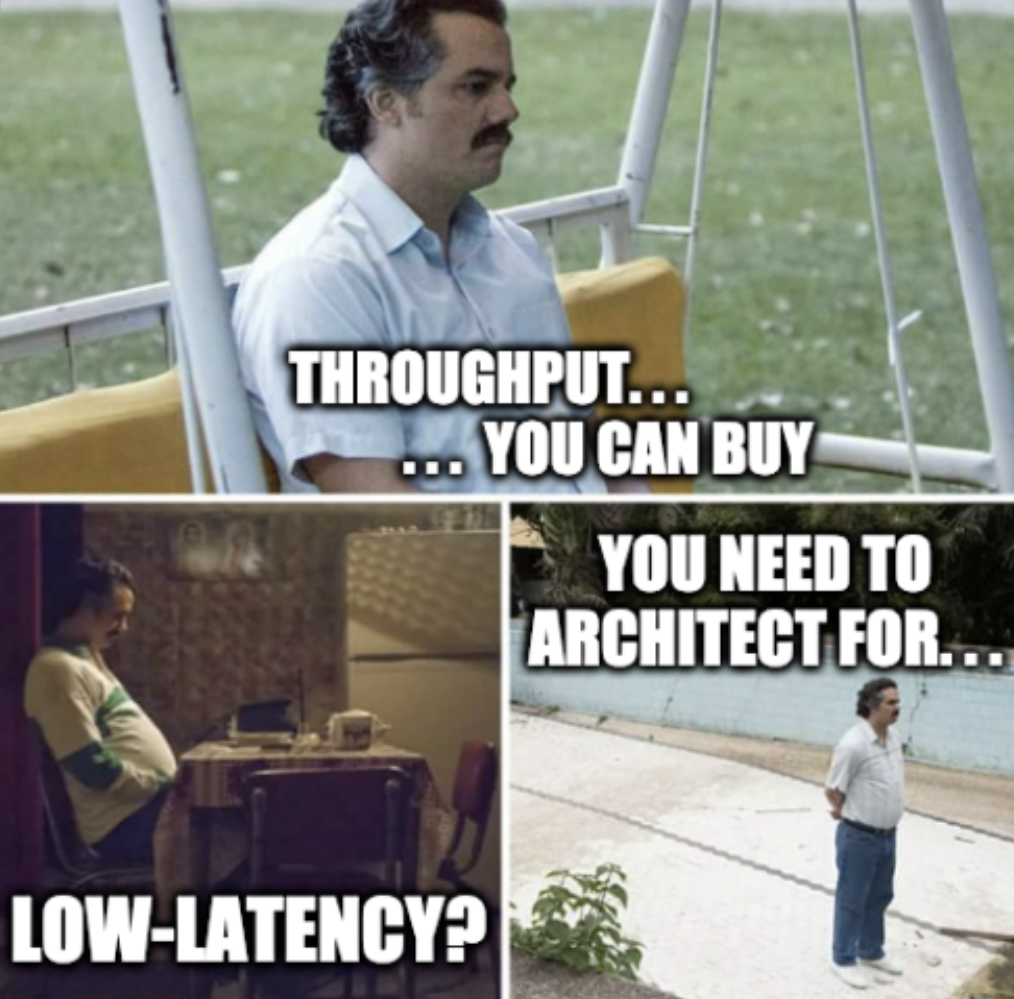
Throughput and latency might be in constant tension, but learning and liveliness certainly are not. Case in point: P99 CONF. Over the past two days, the conference took a deep dive into all things P99 with 35 fascinating sessions, nonstop discussions in the Speakers Lounge, 4 flash polls, and lots of lighthearted fun such as our P99 meme contests. Attendees have also contributed to research for the upcoming State of Distributed Systems report. If you haven’t weighed in yet, please do so now—we’ll donate $10 to code.org for each completed survey.
CHECK OUT ALL OF THE SESSIONS VIA ON-DEMAND VIDEO
Here’s a look at some of the many highlights from the conference.
P99 CONF Day 2 General Sessions
Rust, Wright’s Law, and the Future of Low-Latency Systems — Bryan Cantrill
No recap can do justice to the information-packed and impassioned keynote by Bryan Cantrill, co-founder and Chief Technology Officer at Oxide Computer Company. In a brief twenty minutes, he took the audience on a history of computing to date, provided a blazing critique of where we are today, and gave the audience a glimpse of where the industry is heading next. If you missed it, catch it on-demand at the P99 CONF site.
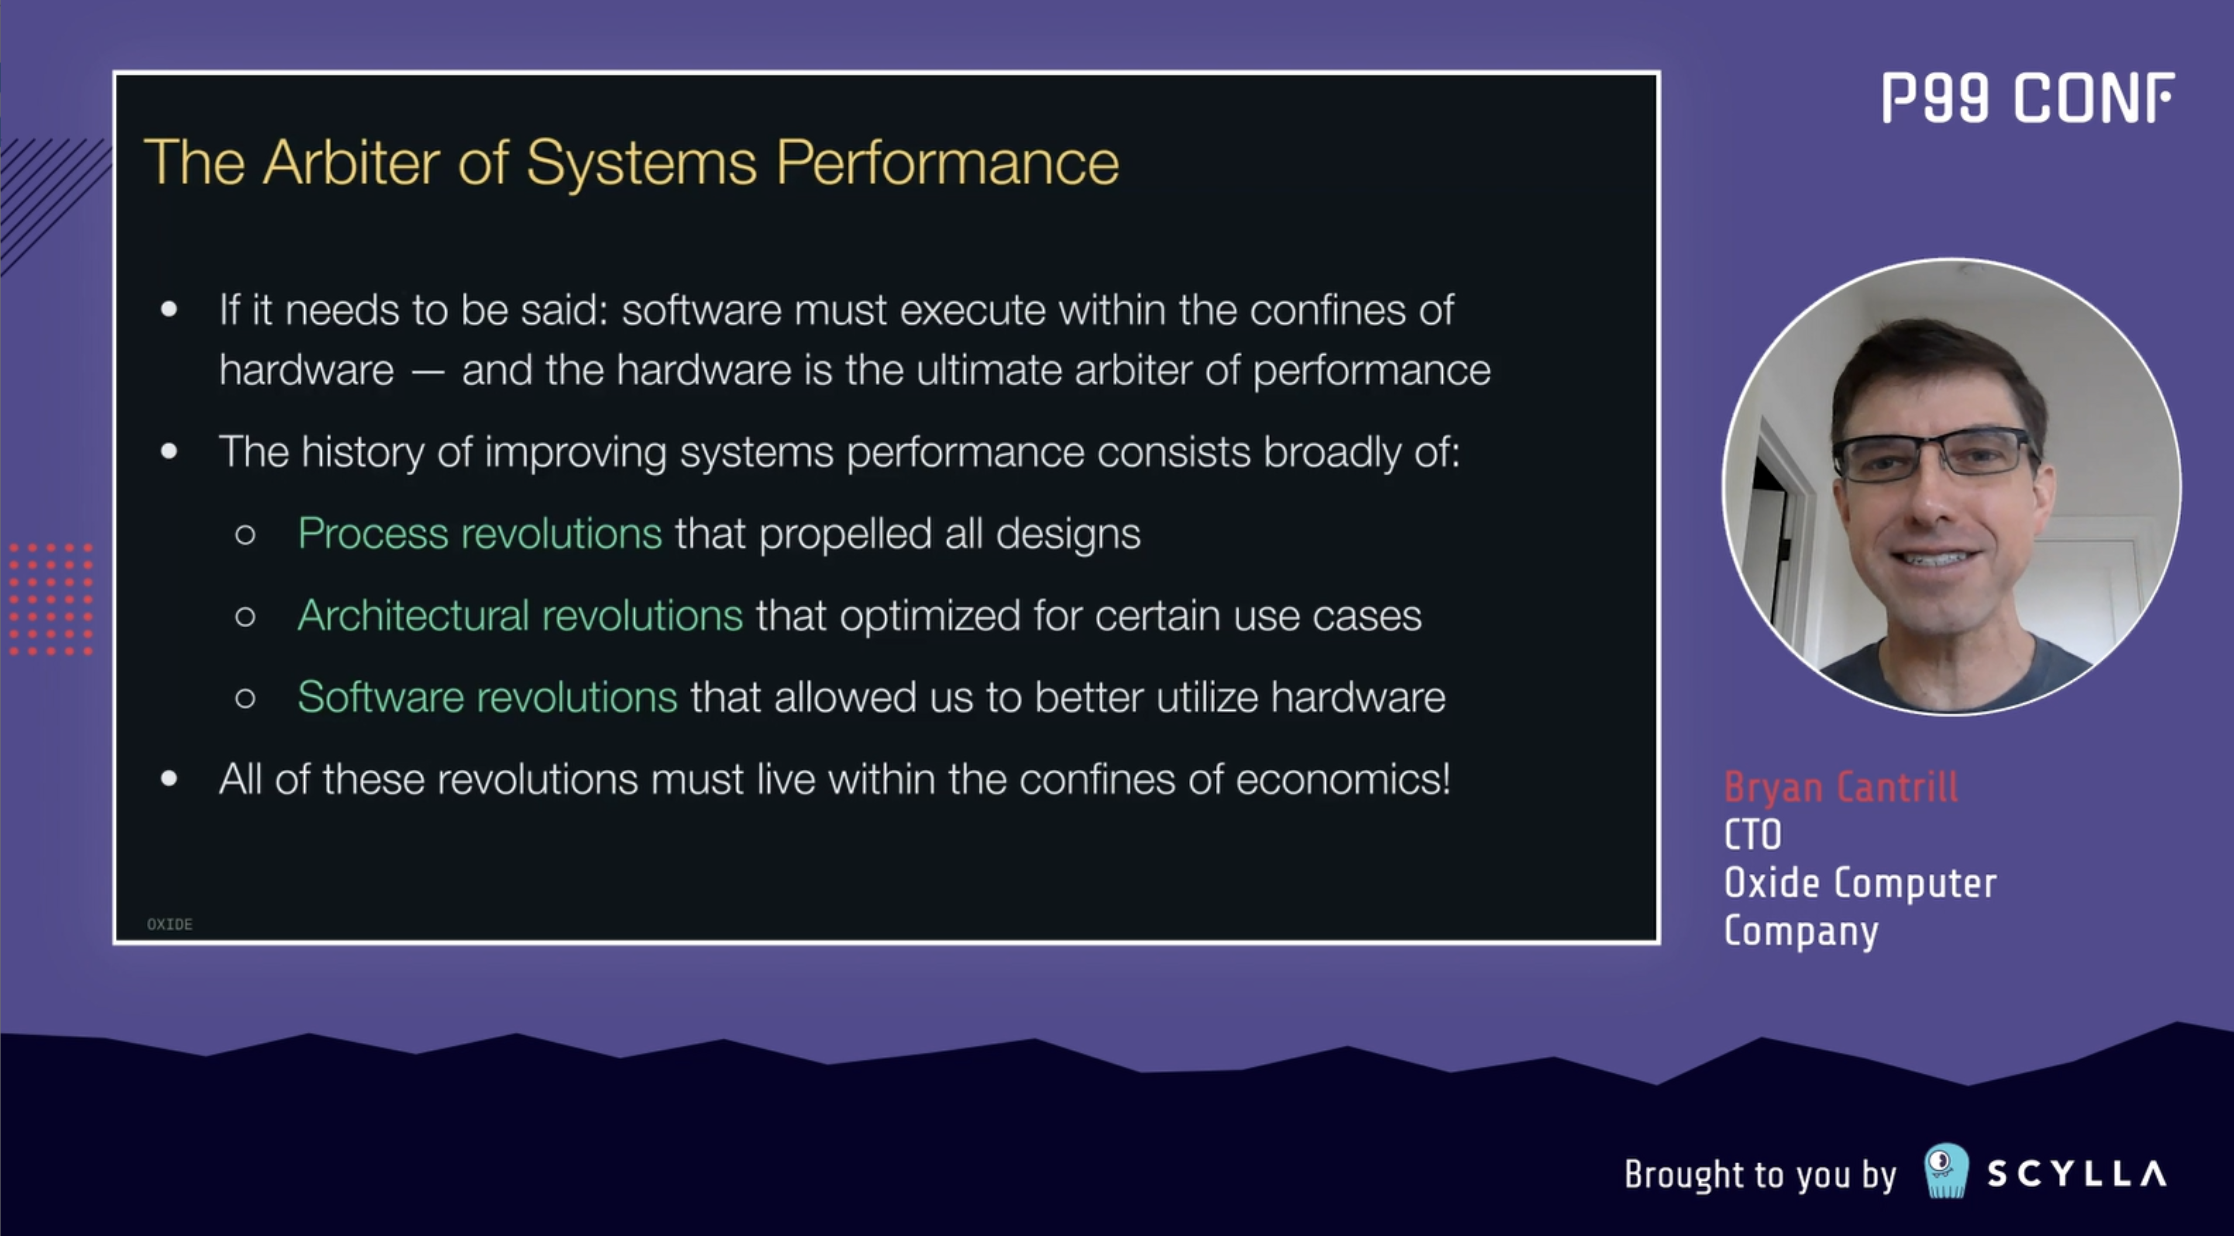
But here’s a tease: Bryan’s conclusion, in his own words…
“Rust is actually the first language since C to meaningfully exist at the boundary of hardware and software. And this is what points us to the future.
Wright’s Law means we’re going to have compute in more places. We are already seeing that. Those compute elements are going to be special purpose. Don’t wait for your general purpose CPU to be shoved down to a SmartNIC. It’s going to draw too much power. We can’t have memory that fast down there.
But what we can put down there is Rust. Rust can fit into these places. We are going to see many more exciting de novo hardware-facing Rust systems that — thanks to no_std — will be able to build on one another.
It’s a very exciting time to be developing high-performance low-latency systems, and the Rust revolution is very much here.”
Bonus: Here’s a direct link to the session Bryan encouraged everyone to watch: It’s Time for Operating Systems to Rediscover Hardware.
New Ways to Find Latency in Linux Using Tracing — Steven Rostedt
In the day’s second keynote, Steven Rostedt (Open Source Engineer at VMware) delivered an excellent deep dive into new flexible and dynamic aspects of ftrace (a tool designed to help developers find what is going on inside the Linux kernel) that can help expose latency issues.
Steven is actually the main author, developer, and maintainer of ftrace — so he obviously offers unparalleled insight into this topic. Again, an on-demand video is worth well more than a thousand words, so please watch this session in its entirety.
For now, here’s Steven providing some color around ftrace’s history…
“ftrace is the official tracer of the Linux kernel. It was introduced in 2008, but before that, it essentially had two parents. I had a tracer that I used way back for my master’s thesis in 1998. And then there’s this tracer that was part of the PREEMPT_RT patch back in 2004…Back around 2007, people liked a lot of the infrastructure that the PREEMPT_RT patch had and asked if we could get that into mainline. Well, the infrastructure that the PREEMPT_RT patch had for tracing was not made for production use; it was just to debug the current situation. To make it mainline, we had to clean it up and rewrite it.
One of the issues with the old version is if that you wanted a wakeup latency tracer, you would compile it into your kernel, boot the kernel, and the tracer was enabled. When you were done and you wanted to disable it, you would compile it out of the kernel, reboot your kernel, and the wakeup latency tracer was no longer running. This wasn’t something we encouraged. We wanted to have these tracers in production use, but we didn’t want people rebooting their kernels.
I took on the endeavor to rewrite everything basically from scratch and come up with (what is now known as) the ftrace infrastructure that allows you to turn on and off different tracers at runtime without recompiling, without rebooting your kernel. To make it fit for production use, a lot of effort was put into ensuring that when these tracers and these plugins were disabled, they would not have an overhead for the system. If it had overhead, people wouldn’t compile it and wouldn’t be on production systems.”
Track Sessions Across Core Low Latency Themes
Here’s an overview of Day 2’s fantastic track sessions, grouped by topic:
Observability
- Gunnar Morling (Red Hat) detailed how to use JfrUnit to track metrics that could impact application performance in “Continuous Performance Regression Testing with JfrUnit.”
- Andreas Grabner (Dynatrace) shared how to use the CNCF Keptn project to automate SLO-based Performance Analysis as part of your CD process in “Using SLOs for Continuous Performance Optimizations of Your k8s Workloads.”
- Felipe Oliveira (Redis) explained how to use several OSS data structures to incorporate telemetry features at scale… and why they matter in scenarios with performance/security/ops issues in “Data Structures for High Resolution, Real-time Telemetry at Scale.”
Programming Languages
- Simon Ritter (Azul Systems) offered strategies for hitting p99 SLAs in Java — despite the various challenges presented by the JVM — in “Get Lower Latency and Higher Throughput for Java Applications.”
- Peter Portante (Red Hat) presented a Linux kernel modification that gives the SRE and logging source owner greater control over bandwidth in “Let’s Fix Logging Once and for All.”
- Stefan Johansson (Oracle) shared insights on the G1 JVM garbage collector — what’s new, how it impacts performance, and what’s on the roadmap — in “G1: To Infinity and Beyond.”
New Hardware Architectures
- Roman Shaposhnik and Kathy Giori (Zededa) teamed up to share their experience porting Alpine Linux and LF Edge EVE-OS to the new RISC-V architecture in “RISC-V on Edge: Porting EVE and Alpine Linux to RISC-V.”
Unikernels
- Waldek Kozaczuk (OSv committer) talked about optimizing a guest OS to run stateless and serverless apps in the cloud for CNN’s video supply chain in “OSv Unikernel — Optimizing Guest OS to Run Stateless and Serverless Apps in the Cloud.”
- Felipe Huici (NEC Laboratories Europe) showcased the utility and design of UnikraftSDK in “Unikraft: Fast, Specialized Unikernels the Easy Way.”
Streaming Data Architectures
- Pere Urbón-Bayes (Confluent) presented strategies for measuring, evaluating, and optimizing the performance of an Apache Kafka-based infrastructure in “Understanding Apache Kafka P99 Latency at Scale.”
Distributed Databases and Storage
- Konstantine Osipov (ScyllaDB) addressed the tradeoffs between hash and range-based sharding in “Avoiding Data Hotspots at Scale.”
- Tejas Chopra (Netflix) shared how Netflix gets massive volumes of media assets and metadata to the cloud fast and cost-efficiently in “Object Compaction in Cloud for High Yield.”
New Operating System Methods
- Bryan McCoid (Couchbase) outlined the ins and outs of Linux kernel tools such as io_uring, eBPF, and AF_XDP and how to use them to handle as much data as possible on a single modern multi-core system in “High-Performance Networking Using eBPF, XDP, and io_uring.”
- Yarden Shafir (Crowdstrike) introduced Windows’ implementation of I/O rings, demonstrating how it’s used, and discussing potential future additions in “I/O Rings and You — Optimizing I/O on Windows.”
- Henrik Rexed (Dynatrace) explained how to use Prometheus + eBPF to understand the inner behavior of Kubernetes clusters and workloads in a step-by-step tutorial in “Using eBPF to Measure the k8s Cluster Health.”
State of Distributed Systems Report
As the event hosts shared, ScyllaDB is in the data collection phase for the upcoming State of Distributed Systems report. This research is designed to help the development community better understand trends associated with high-performance distributed systems.
If you want to help shape this research (and receive the resulting report to learn how you compare to your peers), please complete the short survey. It will take less than 5 minutes, and we’ll donate $10 to code.org for each person who completes the survey.
TAKE THE STATE OF DISTRIBUTED SYSTEMS SURVEY
Speakers Lounge
 Image from Twitter user @drraghavendra91 here
You’re not likely to cross paths with speakers as you grab a coffee during a virtual conference. But at P99 CONF, that doesn’t mean you can’t get your burning questions answered during session Q&A or subtly eavesdrop on their conversations with others.
Peter Corless hosted the P99 CONF Speakers Lounge with Johnny Carson geniality. Here’s Peter’s take on a few memorable moments:
“Bryan Cantrill, as always, was on fire. He can cover more ground in a 20 minute presentation than most speakers can do in an hour. But his strong, often heterodox opinions didn’t stop there. In the speaker’s lounge he hammered home his beliefs on how Rust is going to change the industry — especially on chips embedded in places we hardly ever think about: your SmartNICs, your device controllers. Oxide Computer has, over the past two years of its skunkworks development, built not only an amazing server platform but just wait until they unveil their new Rust-based operating system.”
“What was great about the speaker’s lounge was the back-and-forth. For instance, Simon Ritter raised some eyebrows when he described how Azul’s customers are pushing the envelope of Java, l0oking to scale heap sizes beyond the current limits of 12 terabytes. The use case? Real-time fraud detection. Then he describe some of the low-level — bit-level — challenges to tackle to enable Java to continue to scale.”
“Peter Portante of Red Hat described further this new modification to the Linux kernel that will give SREs — not an app developer, but the SRE themselves — control over the combined bandwidth of logging on a node in a distributed system. I want to emphasize: this is going to be huge. In the discussion, it became apparent this will open up new controls for SREs over the granularity and verbosity of logging, while also providing them a gun to shoot themselves right in the foot if they’re not careful.”
“And that was just the first three speakers. The whole day was like that. New tracing methods, both local and distributed tracing. New programming methods like eBPF and io_uring. A lot of ‘wow!’ moments. Incredible conversations.”
“The speaker back-and-forth — and moreso, the audience back-and-forth with the speakers — was when the p99 CONF made the leap from just being an ‘event’ to being a ‘community.’ This was precisely the kind of interaction we had hoped to foster. As an organizer you can’t force it. But when it just happens — when it unfolds naturally around you? It’s sublime.”
Flash Polls
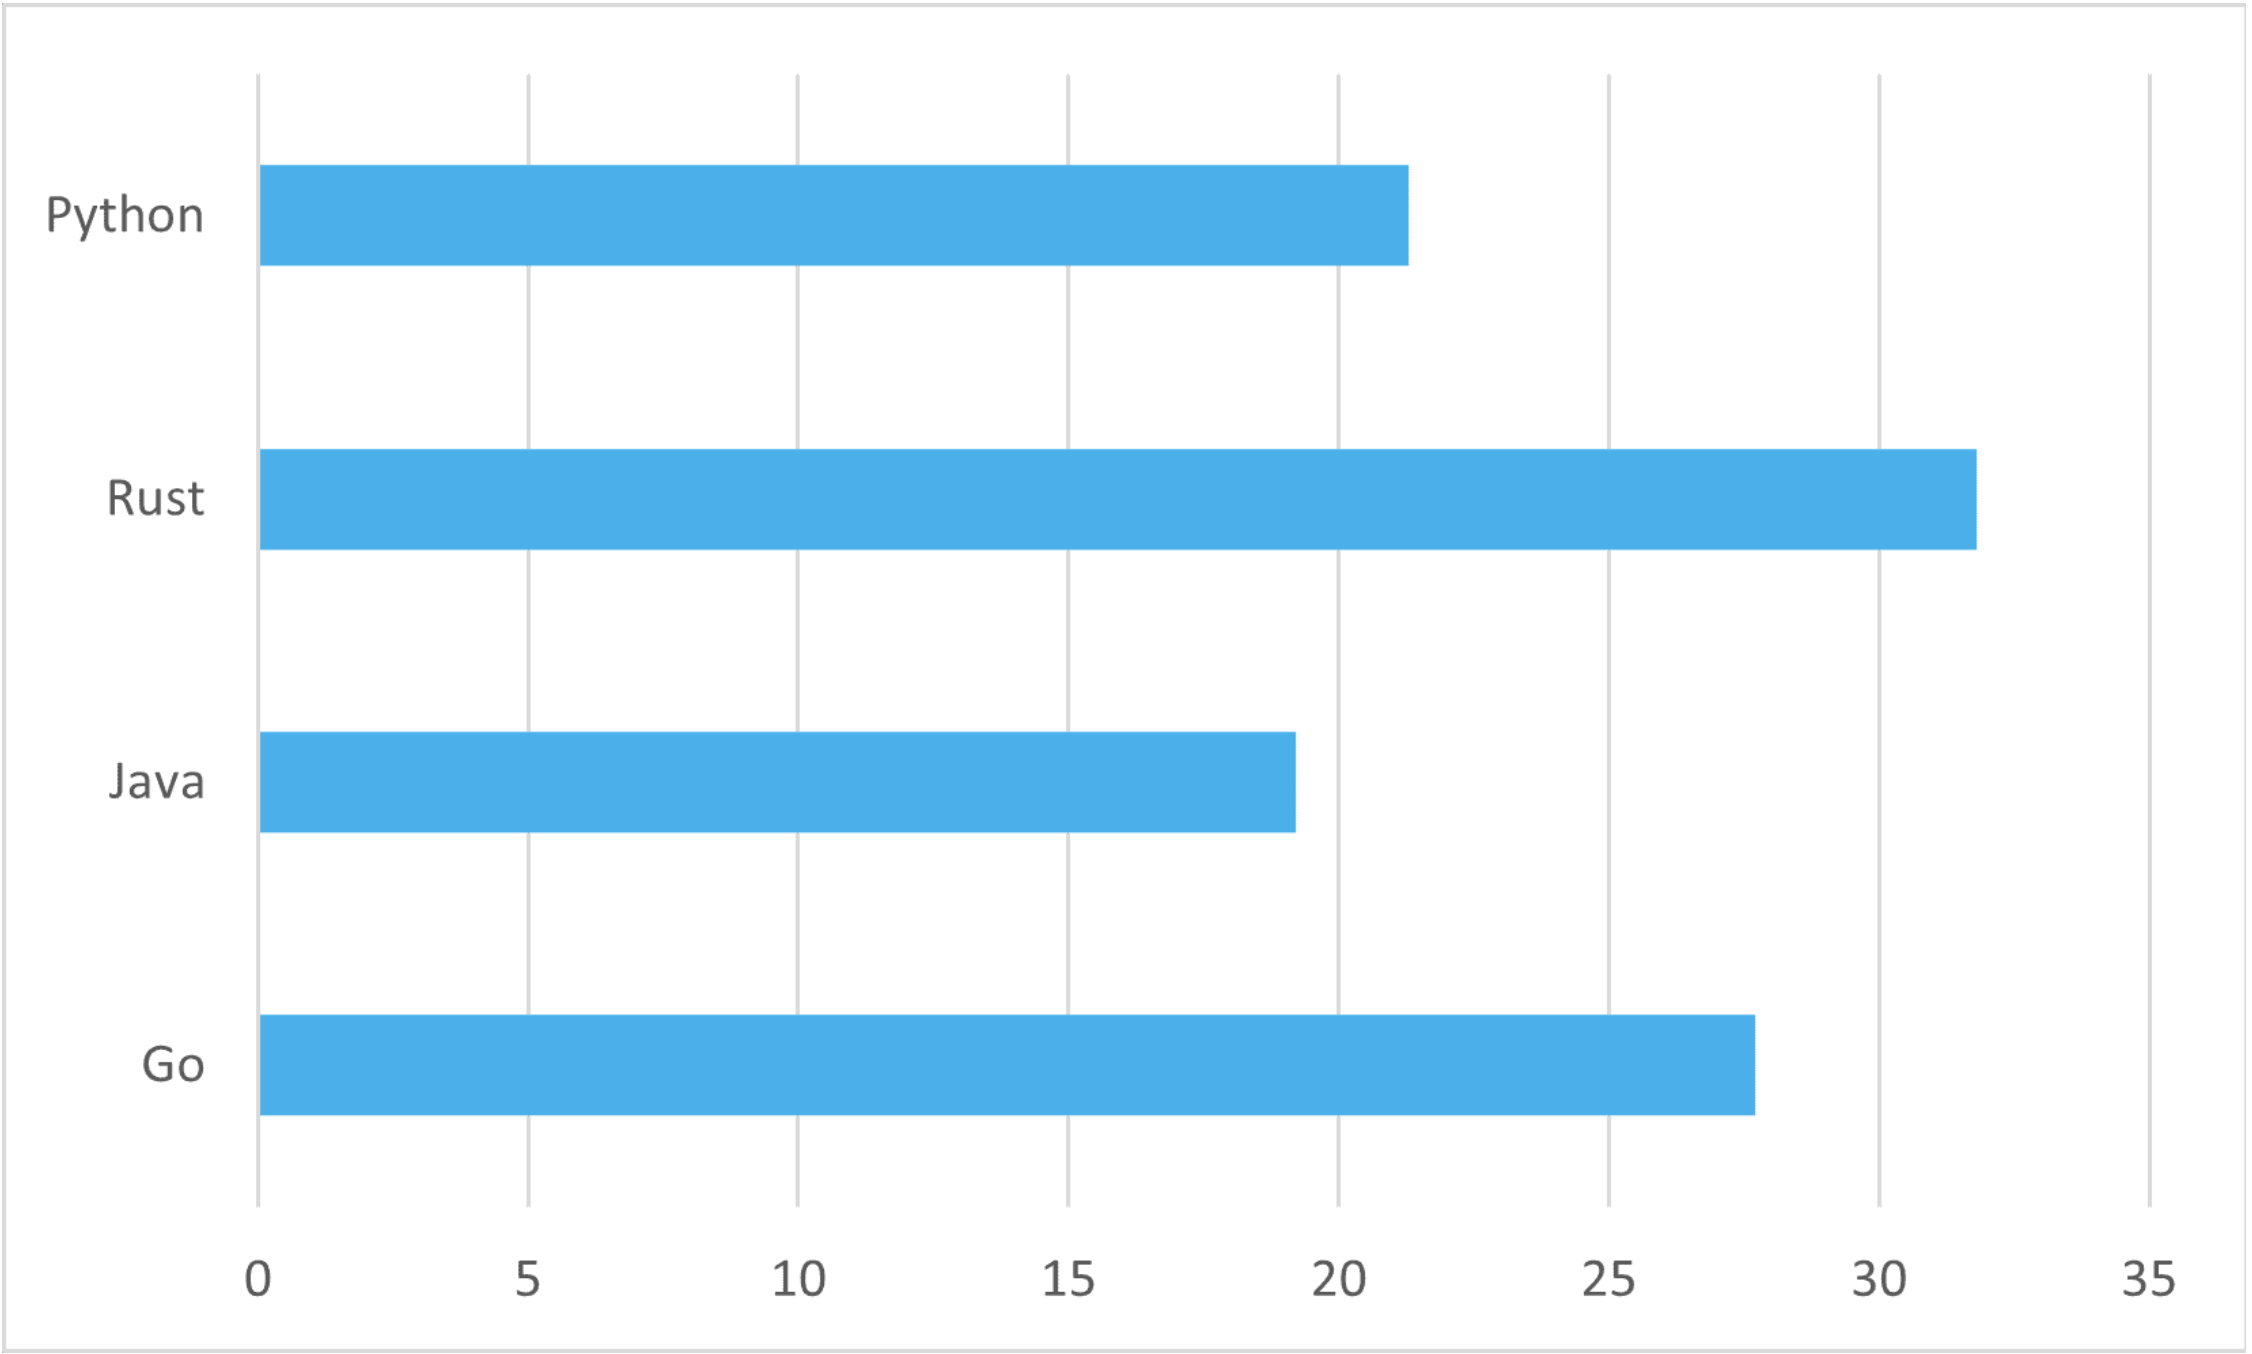
With so many performance-obsessed people gathered in one spot, we thought this was the perfect opportunity for some flash polling. Between sessions, we asked attendees to weigh in on four topics related to P99. Here are all the results:
If you had to select one of the following programming languages for a new project, which would you choose?
Is Kubernetes mature enough for stateful applications?
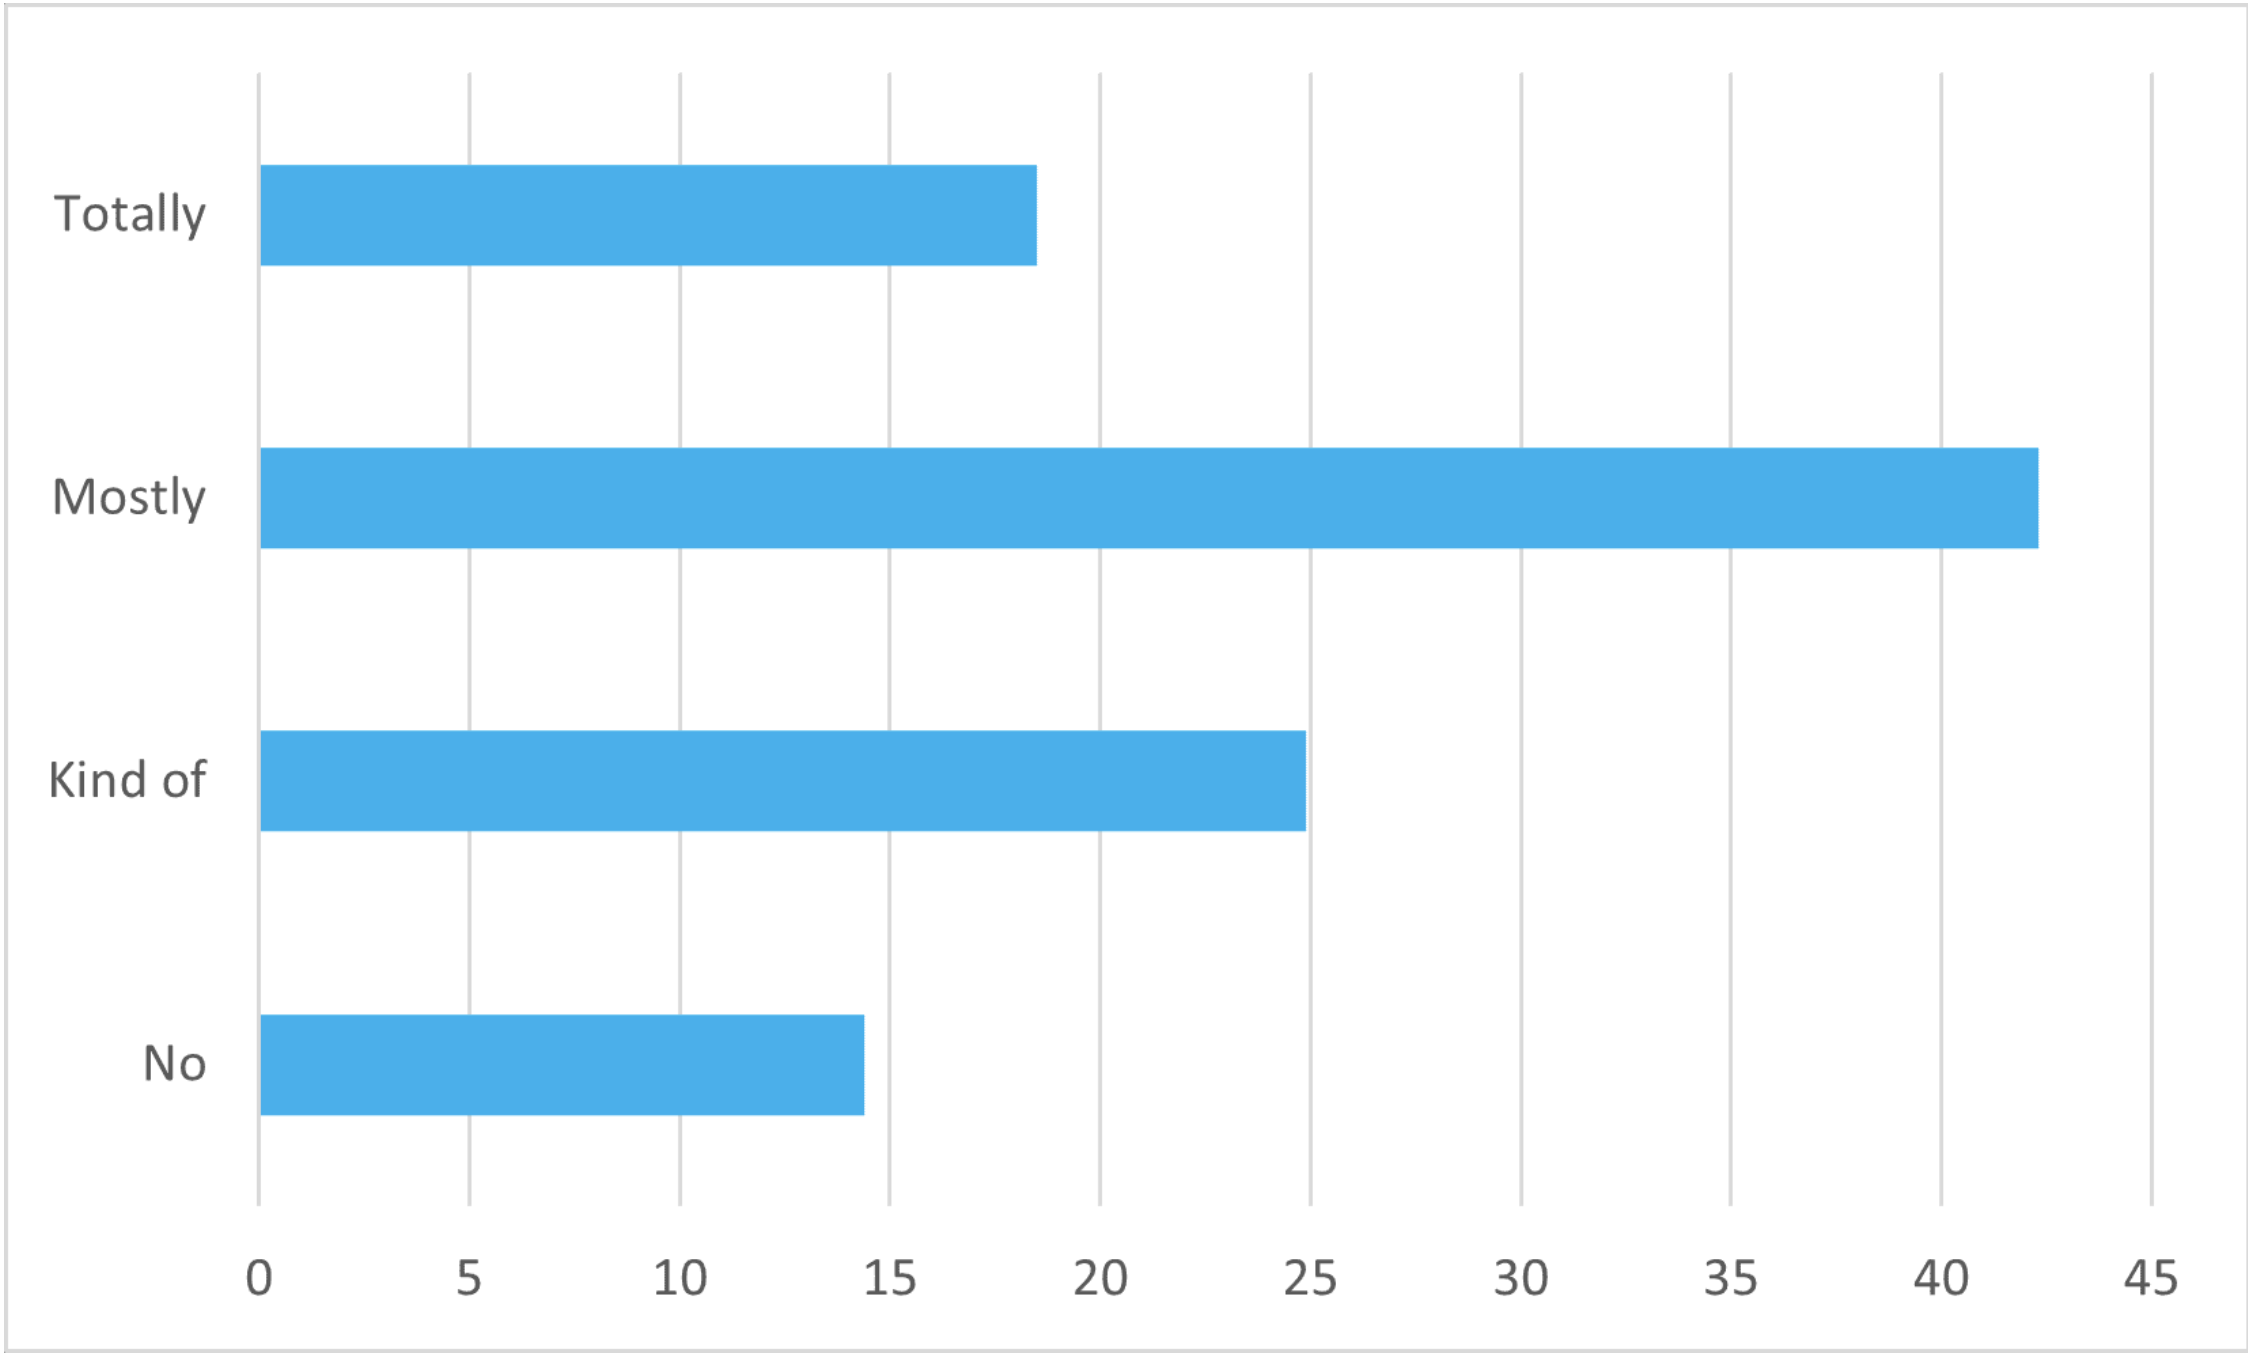
When will Arm overtake Intel?
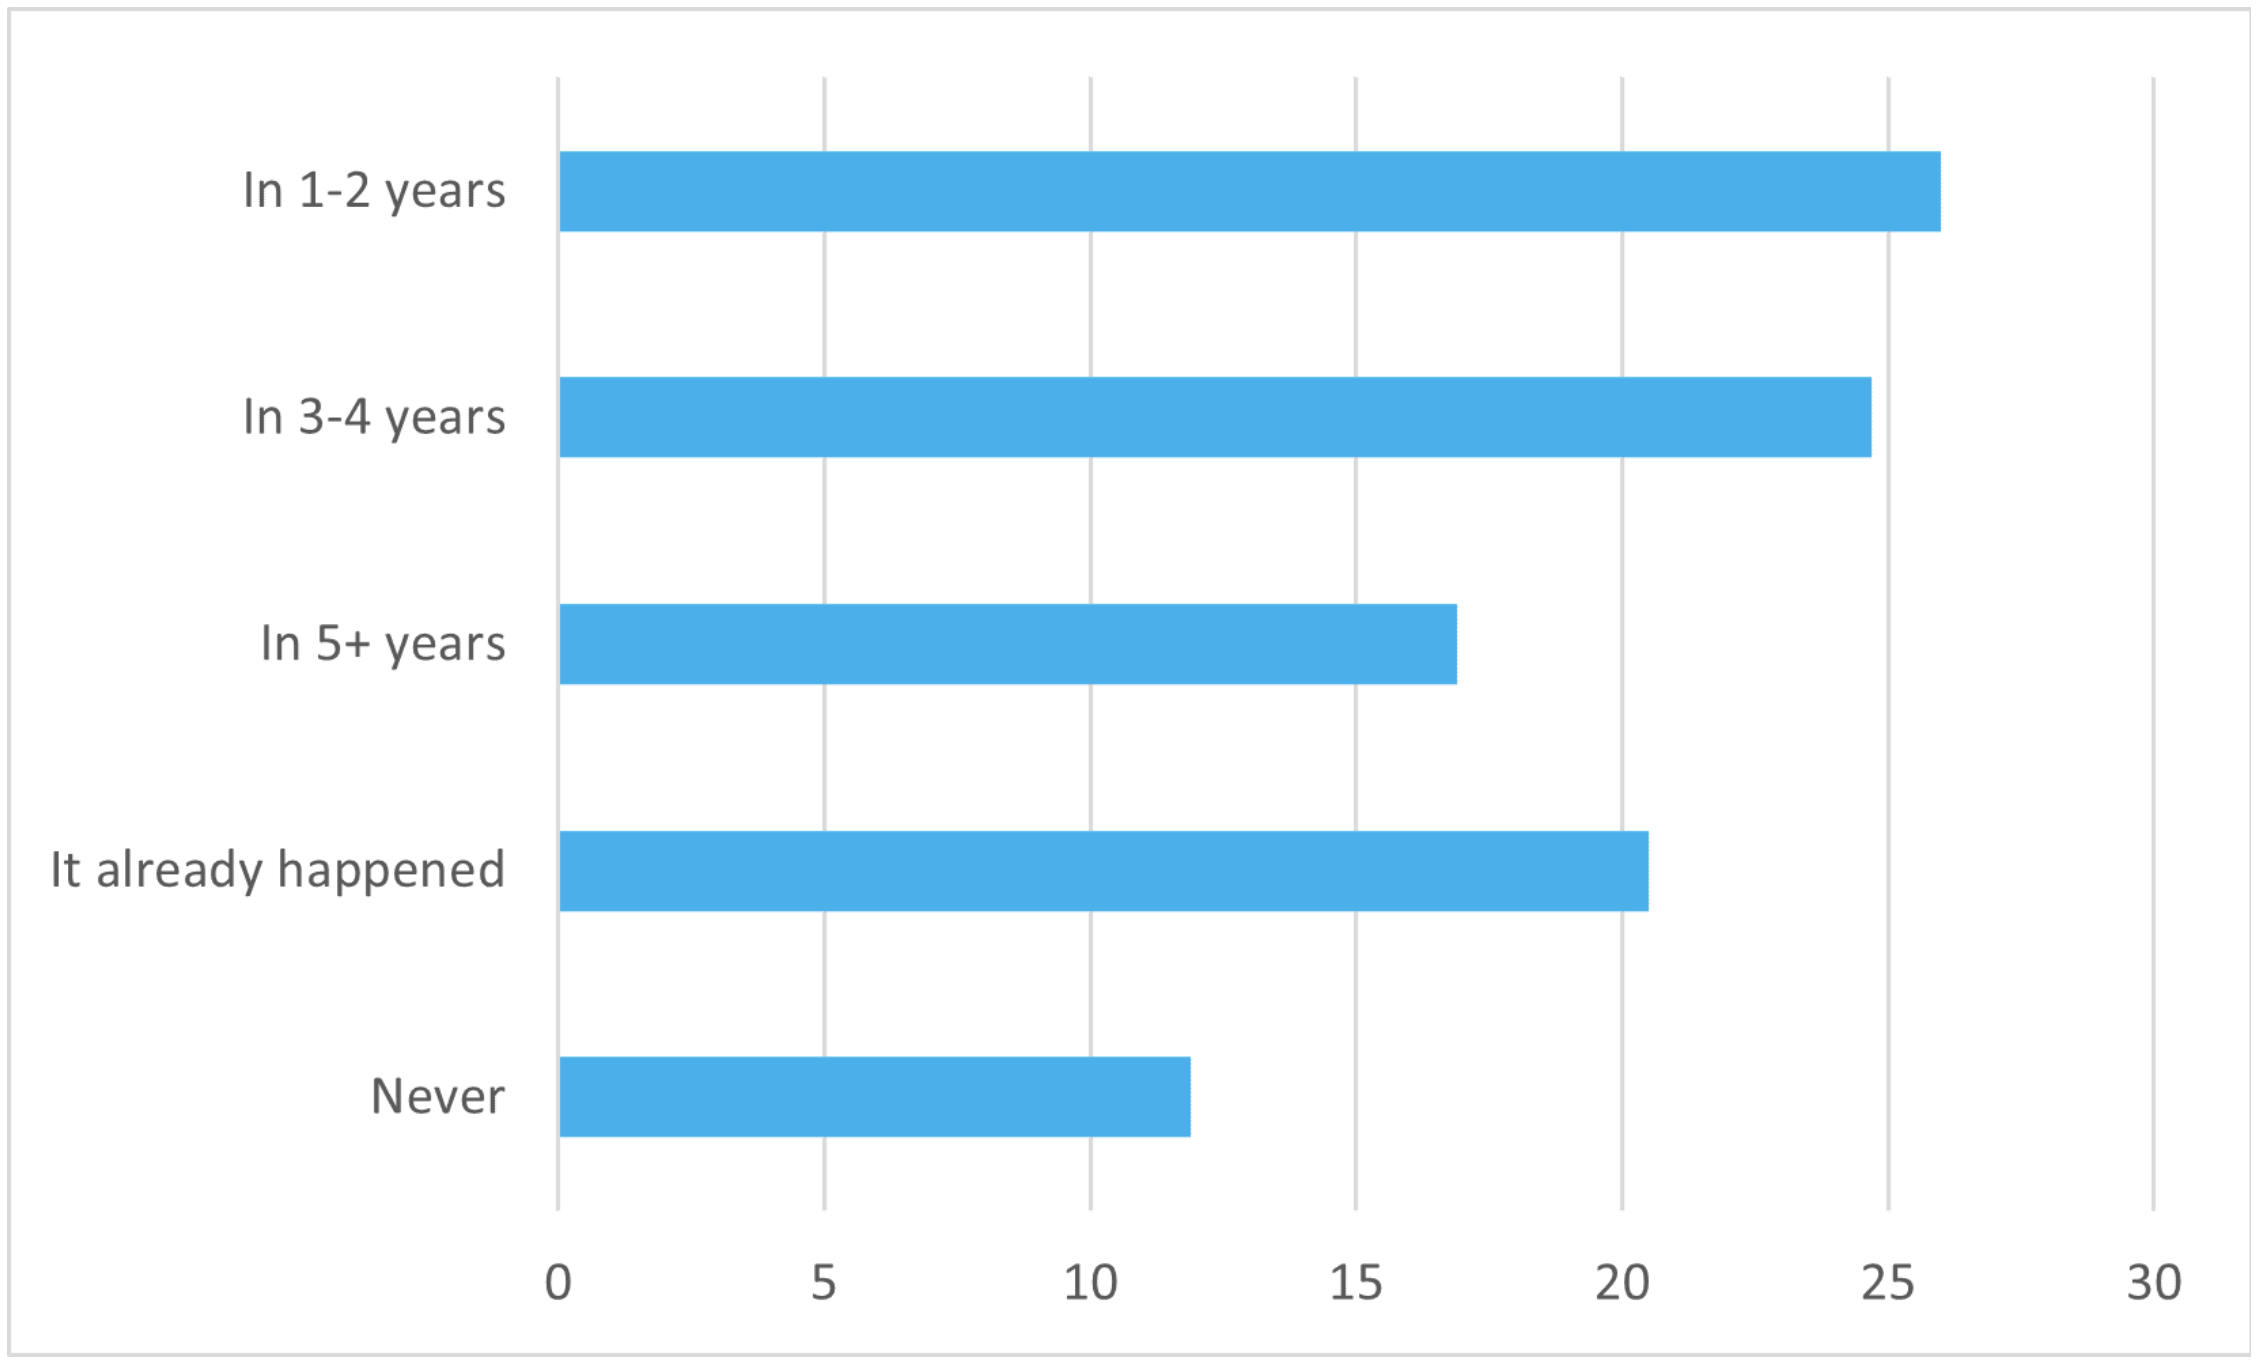
With JDK 17 and ZGC, is Java good enough for high-end systems?
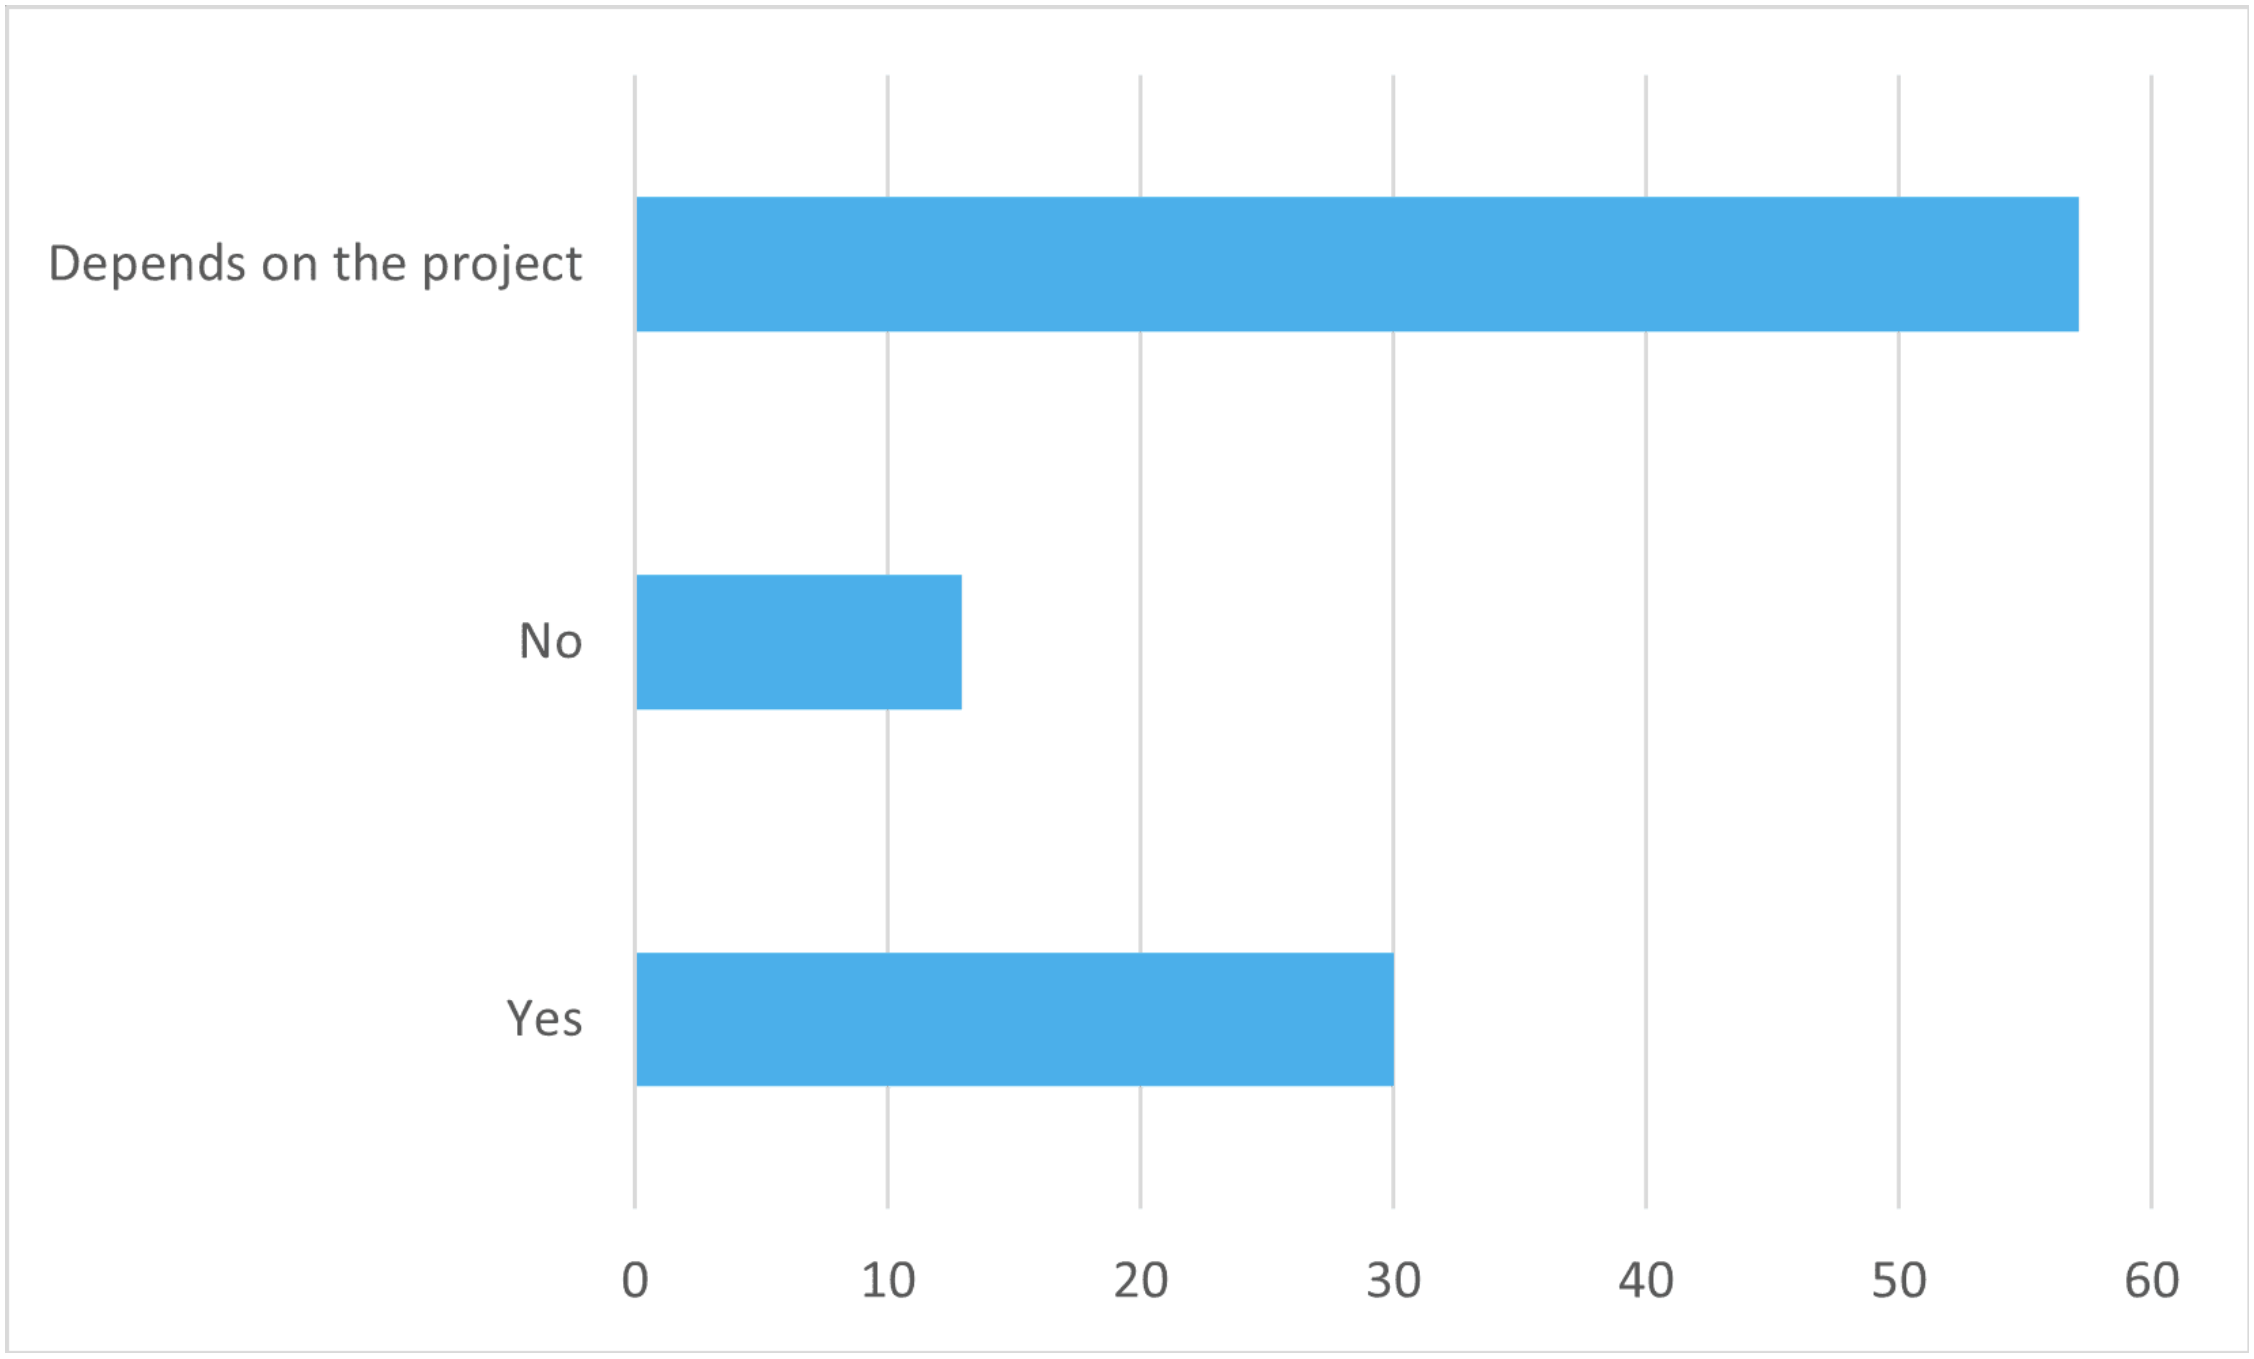
Meme Contest
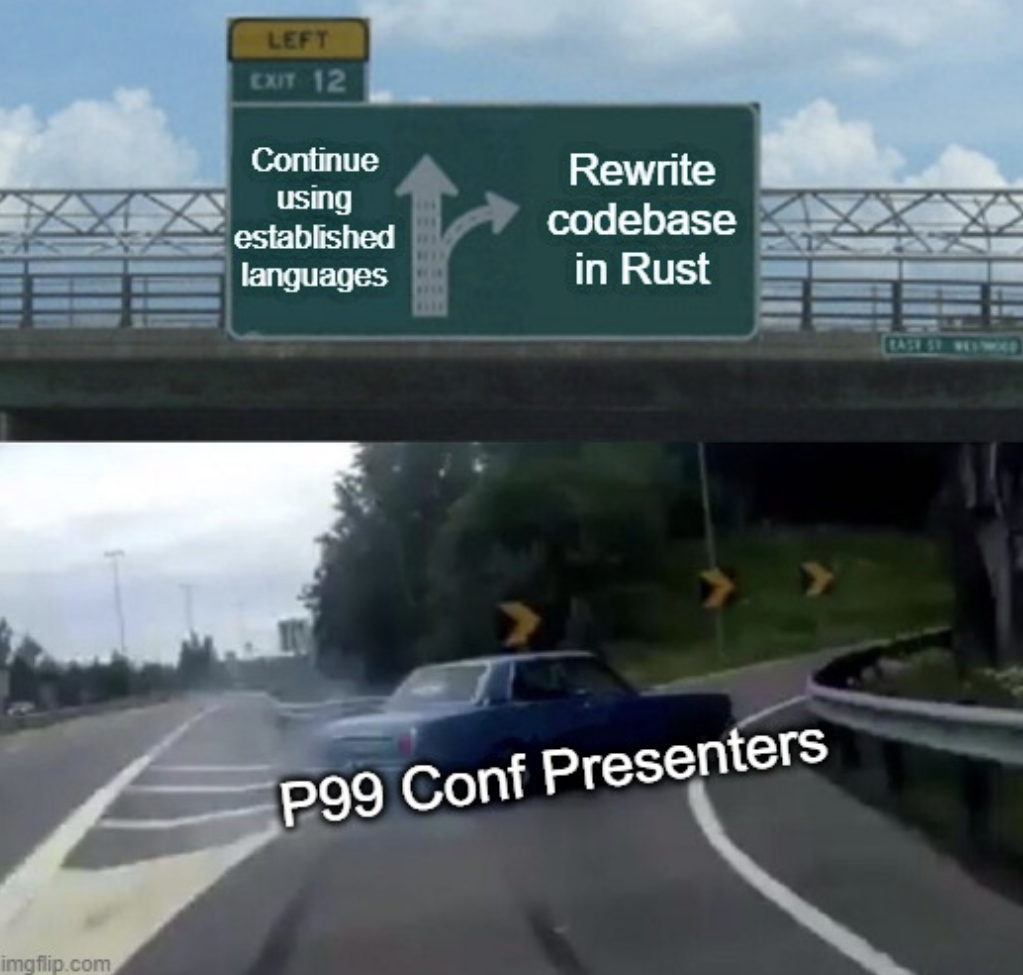
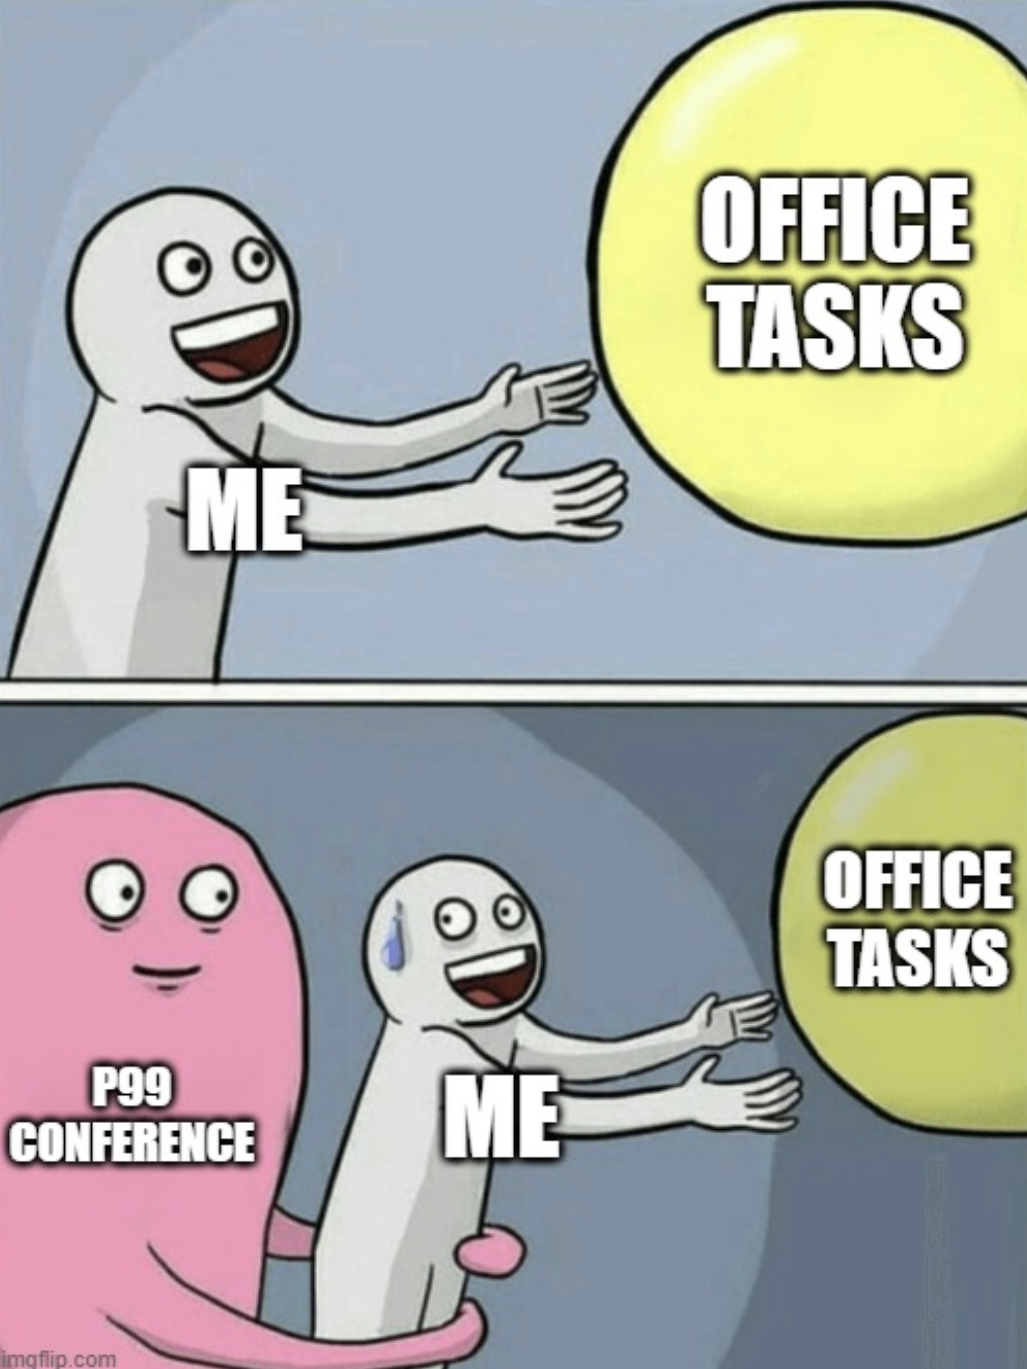
What’s more fun than geeking about all the ways to reduce long-tail latencies? Meme-ing about it, of course. We challenged attendees to create memes using our suggested templates, or freestyle. Thanks to all who participated, and congratulations to these winners:
Lessons learned…
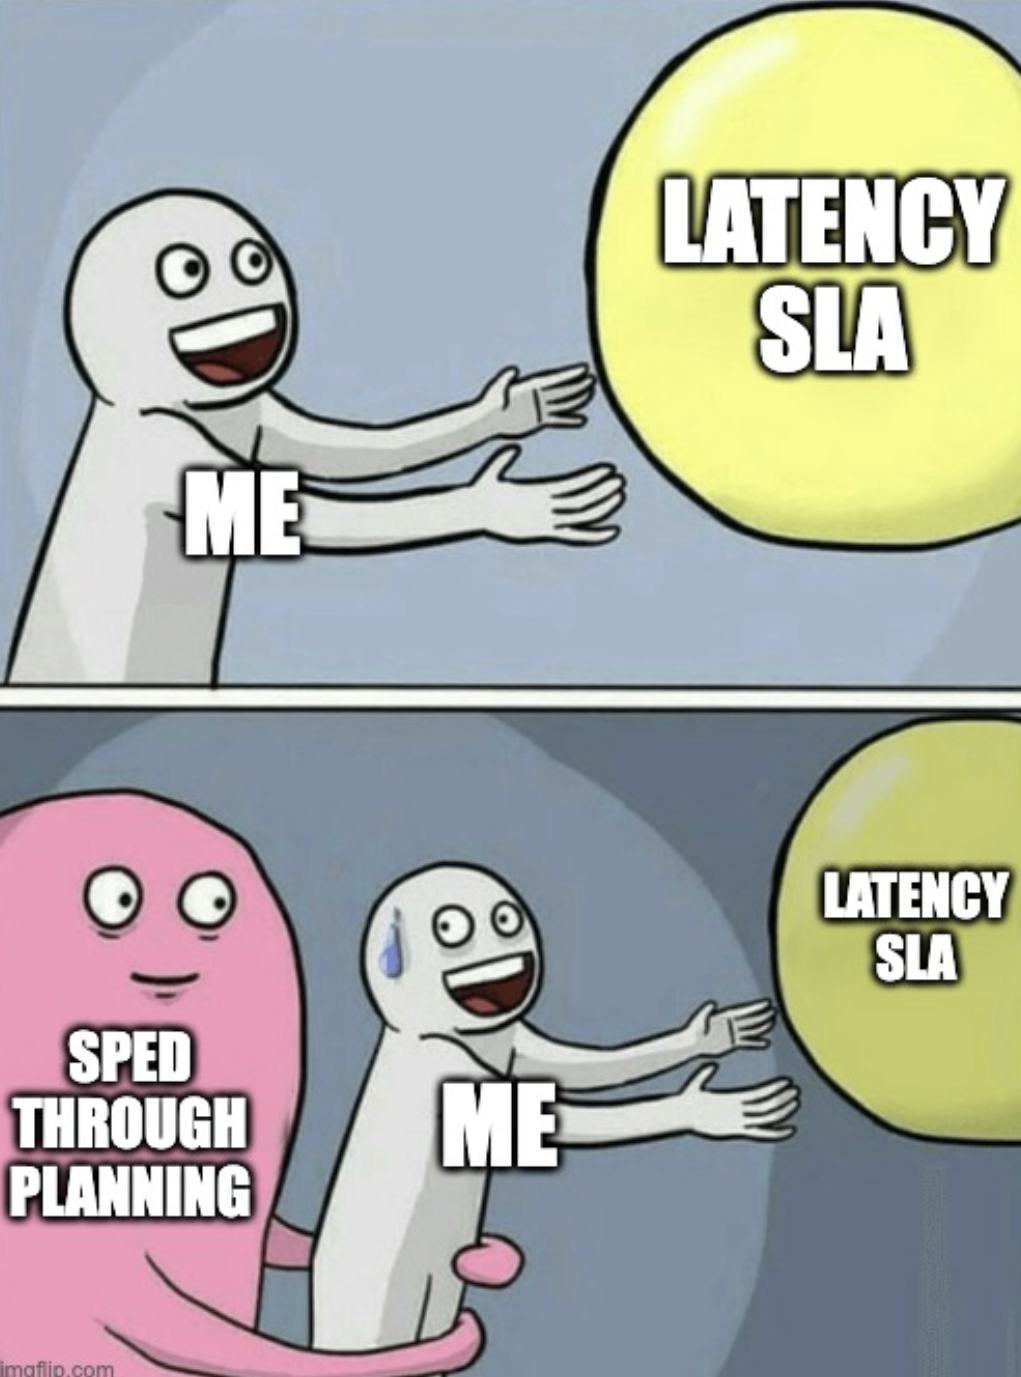
Basically, yes…
Just one more talk…
Reflecting on your life choices…


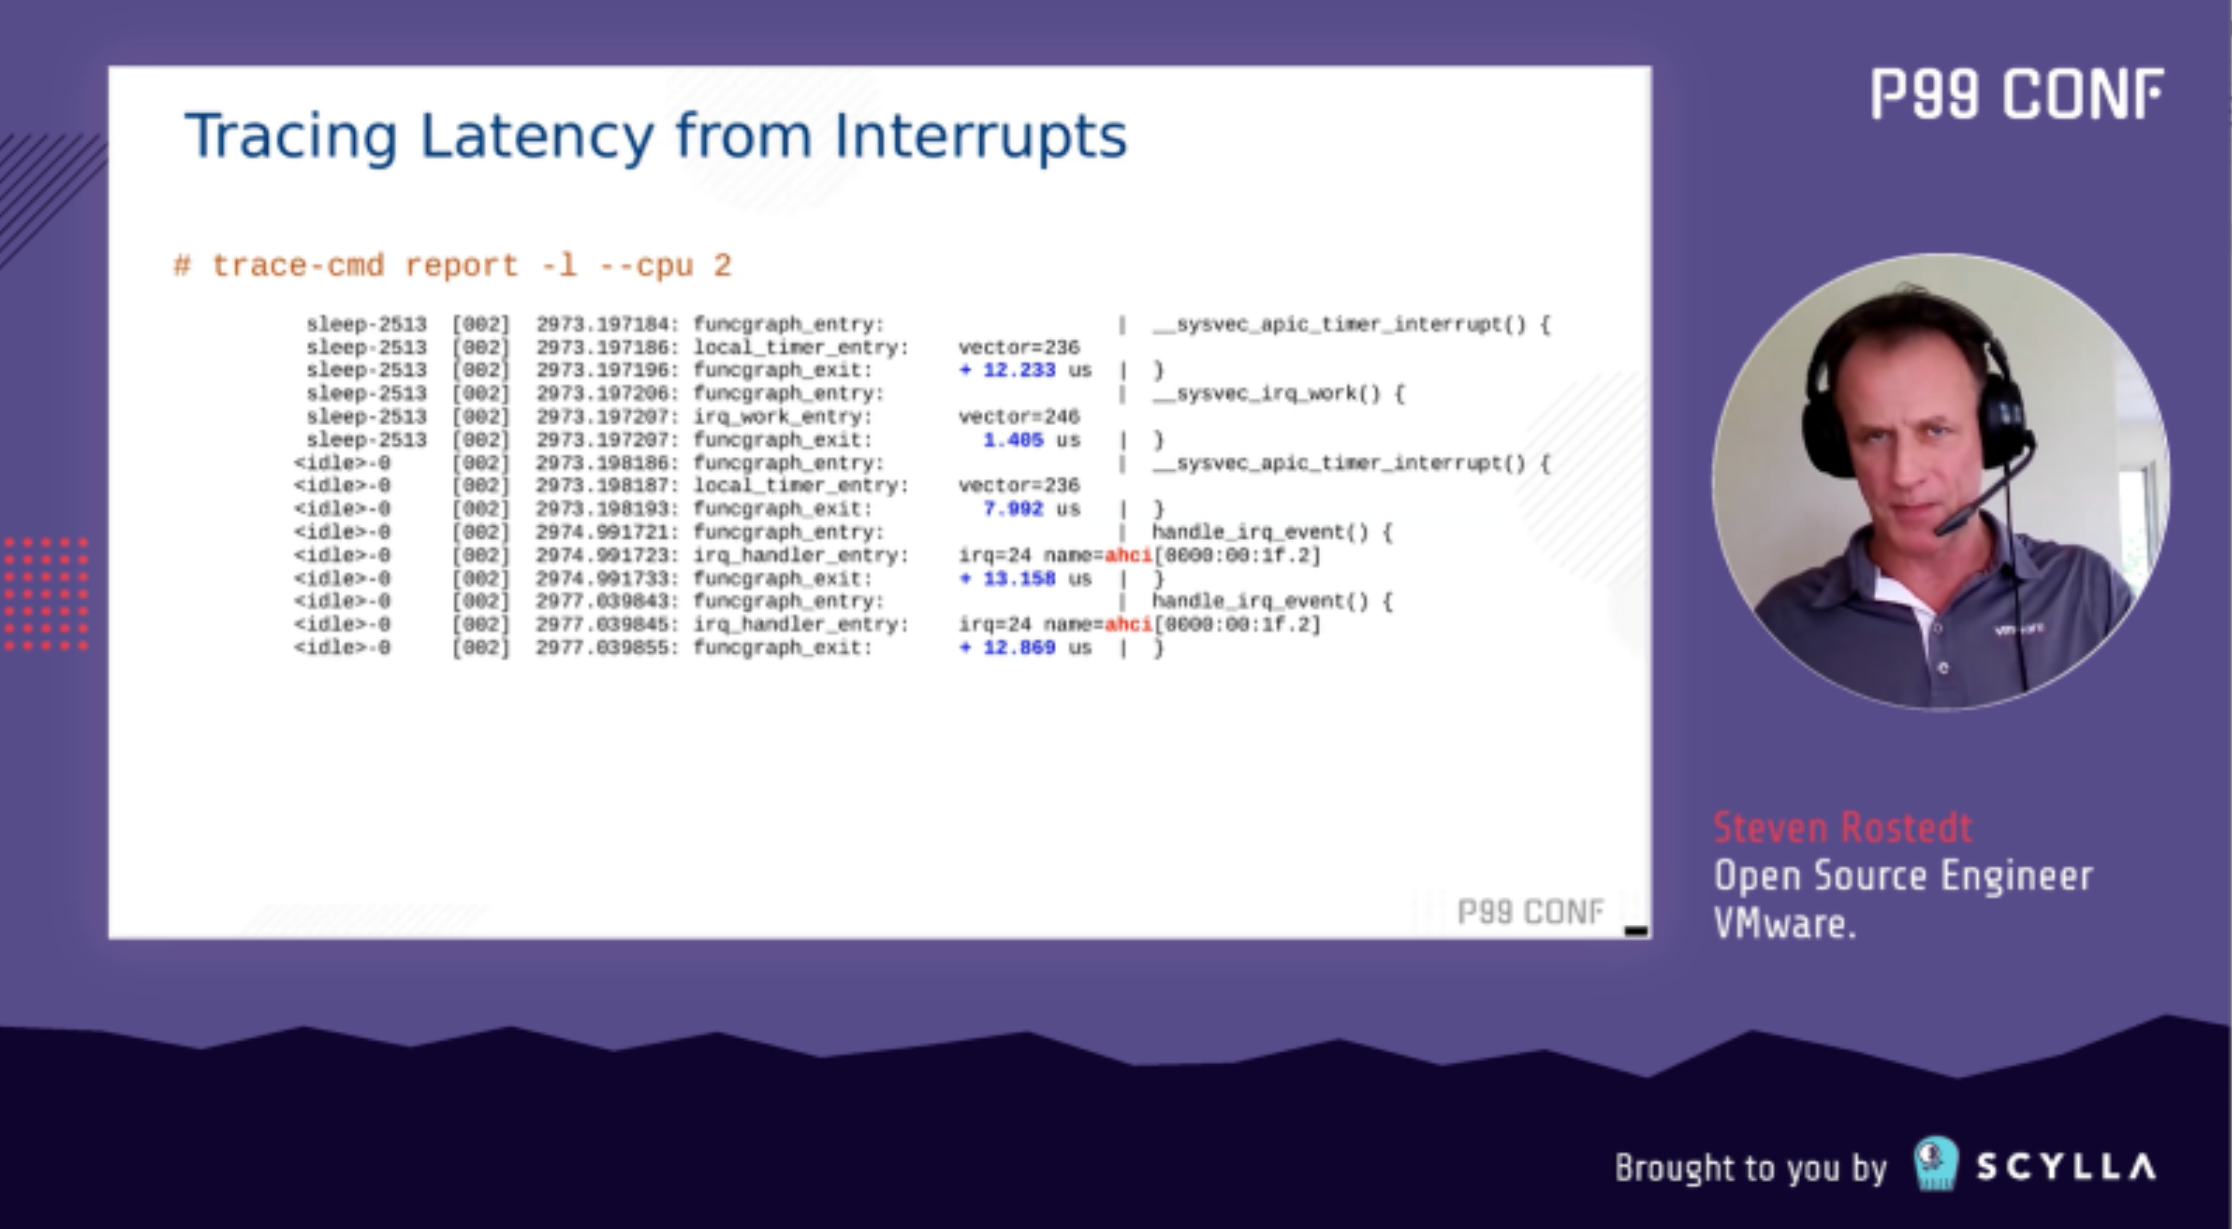
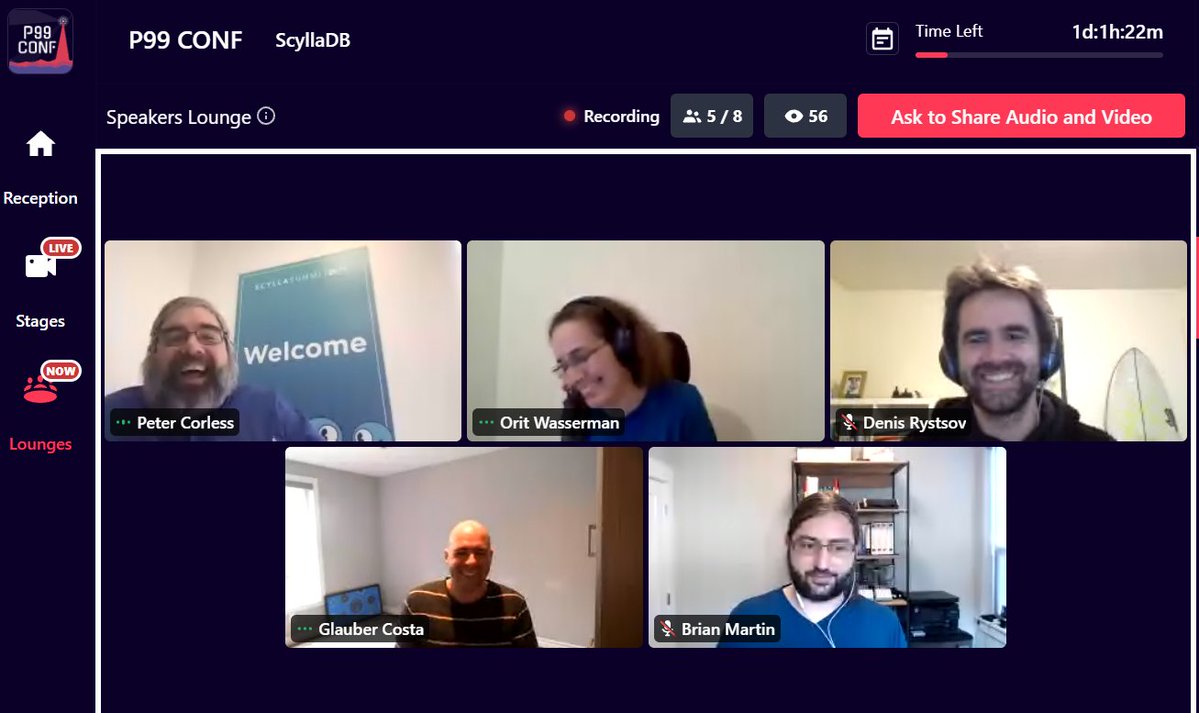 Image from Twitter user