
This post is by P99 CONF speaker Thomas Dullien, CEO of optimyze.cloud, Inc. It first appeared on Prodfiler on September 1, 2021. To hear more from Thomas and many more latency-minded thought leaders, register for P99 CONF today.
System-wide continuous profiling has a habit of turning up performance murder mysteries: The data tells you that something is off in a rather unexpected manner, and an investigation then reveals surprising insights about the deployed systems.
In this blog post, we are going to investigate a mystery involving kubelet – the Kubernetes process responsible for Kubernetes housekeeping.
Our investigation starts with a deployment running Prodfiler on a Kubernetes cluster of 100+ nodes, and running various services on top. To everybody’s great surprise, we’d occasionally see individual machines exhibiting “jumps” in kubelet CPU utilization: kubelet CPU consumption would rise to 10x the normal level and persist over hours or days, consuming almost an entire core.
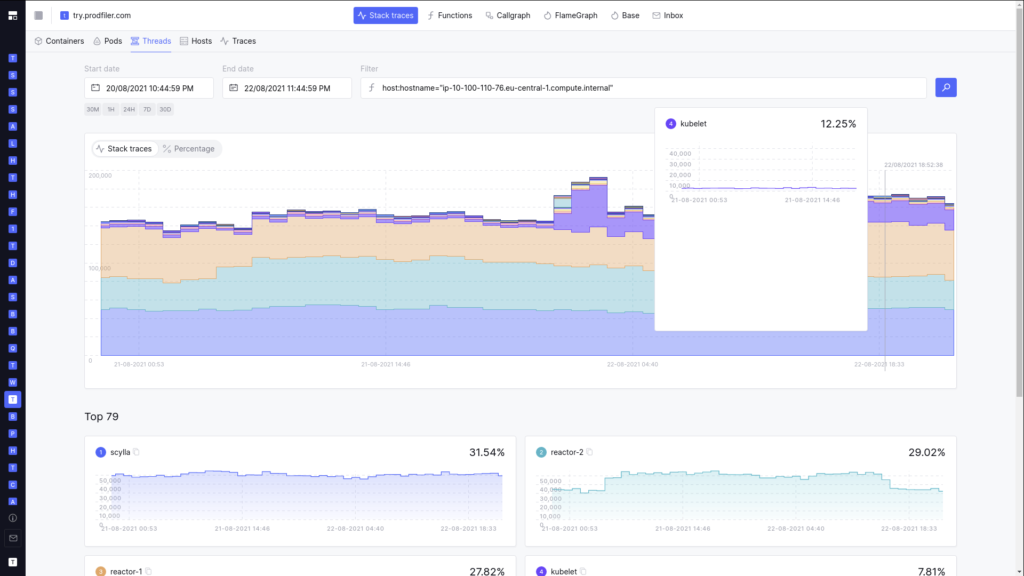
Sudden appearance of 12%+ CPU consumption by `kubelet` on a multicore distributed DB server
The first thing we do in such a scenario is to pull a flamegraph for the corresponding service and time period:
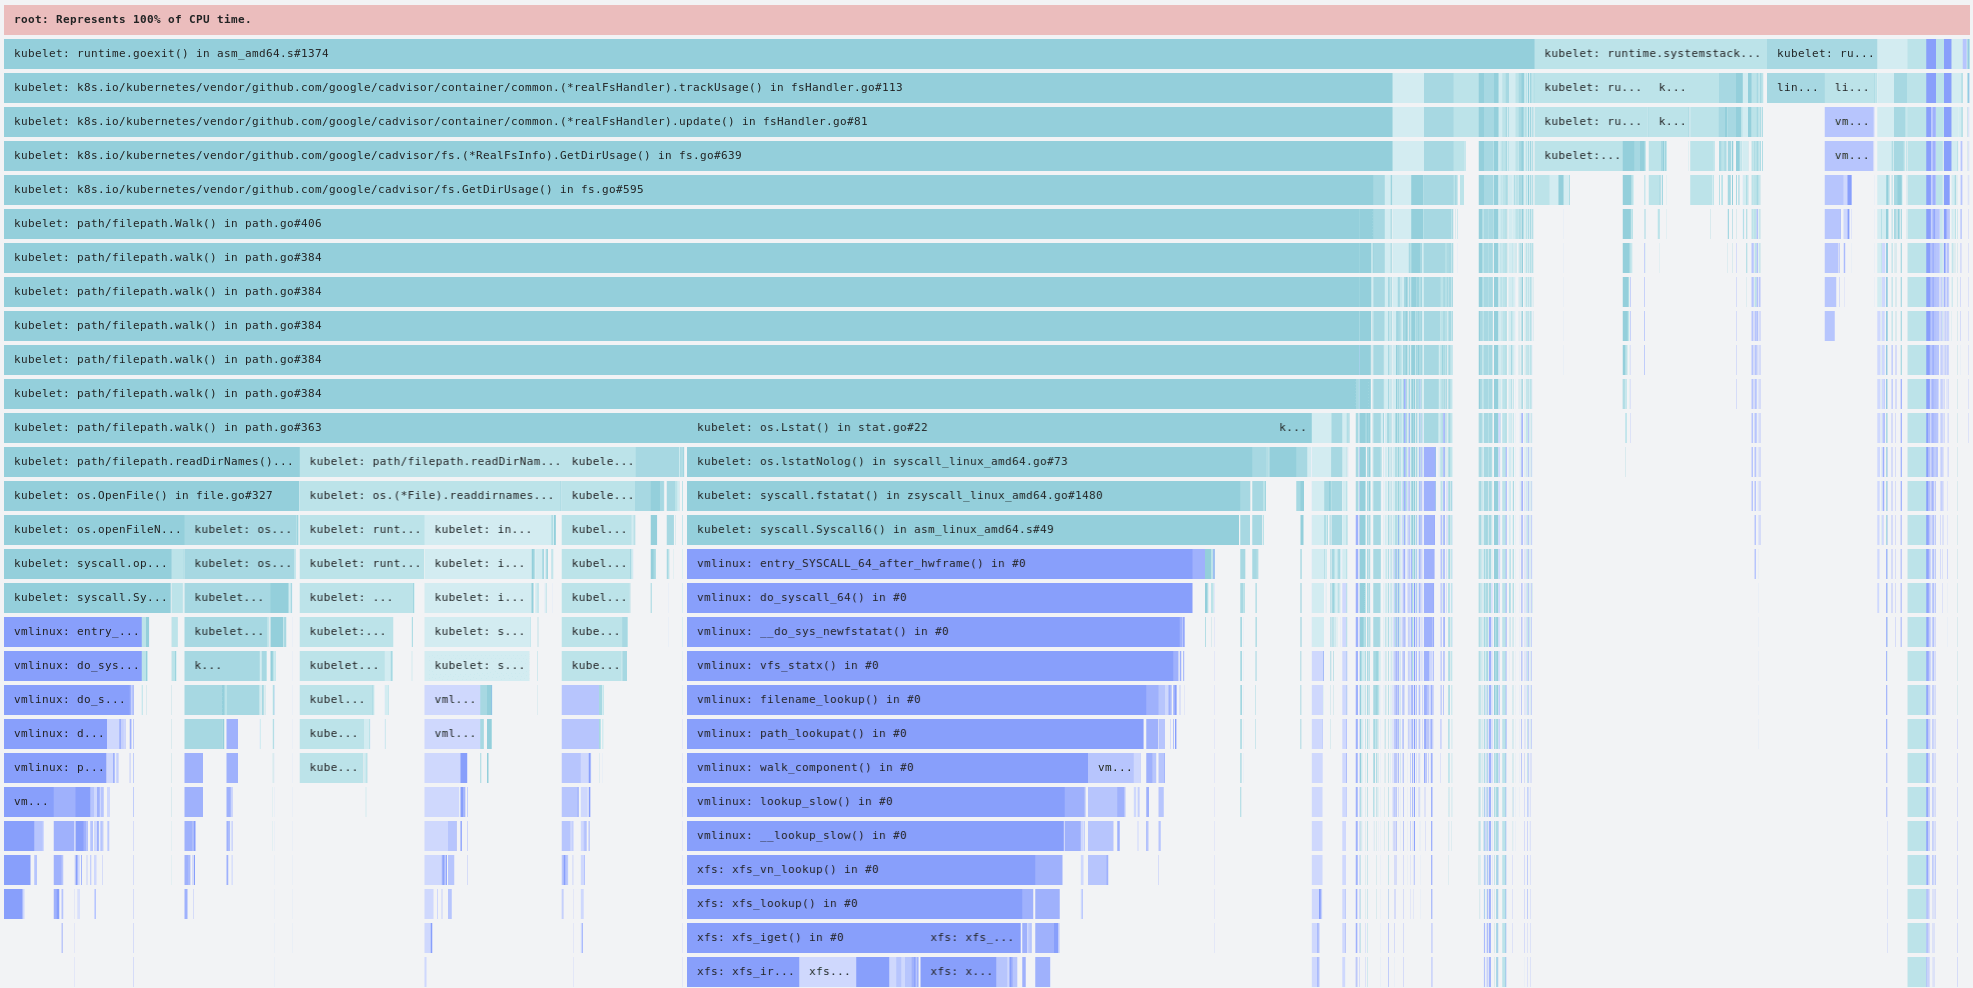
A flamegraph from the offending `kubelet`
To everybody’s great surprise, the increase in CPU consumption from kubelet was almost entirely caused by path/filepath.Walk() code. Pulling a differential flamegraph from before and after the jump in CPU utilization confirmed that the increase was almost entirely from the directory walking (and the corresponding GC pressure).
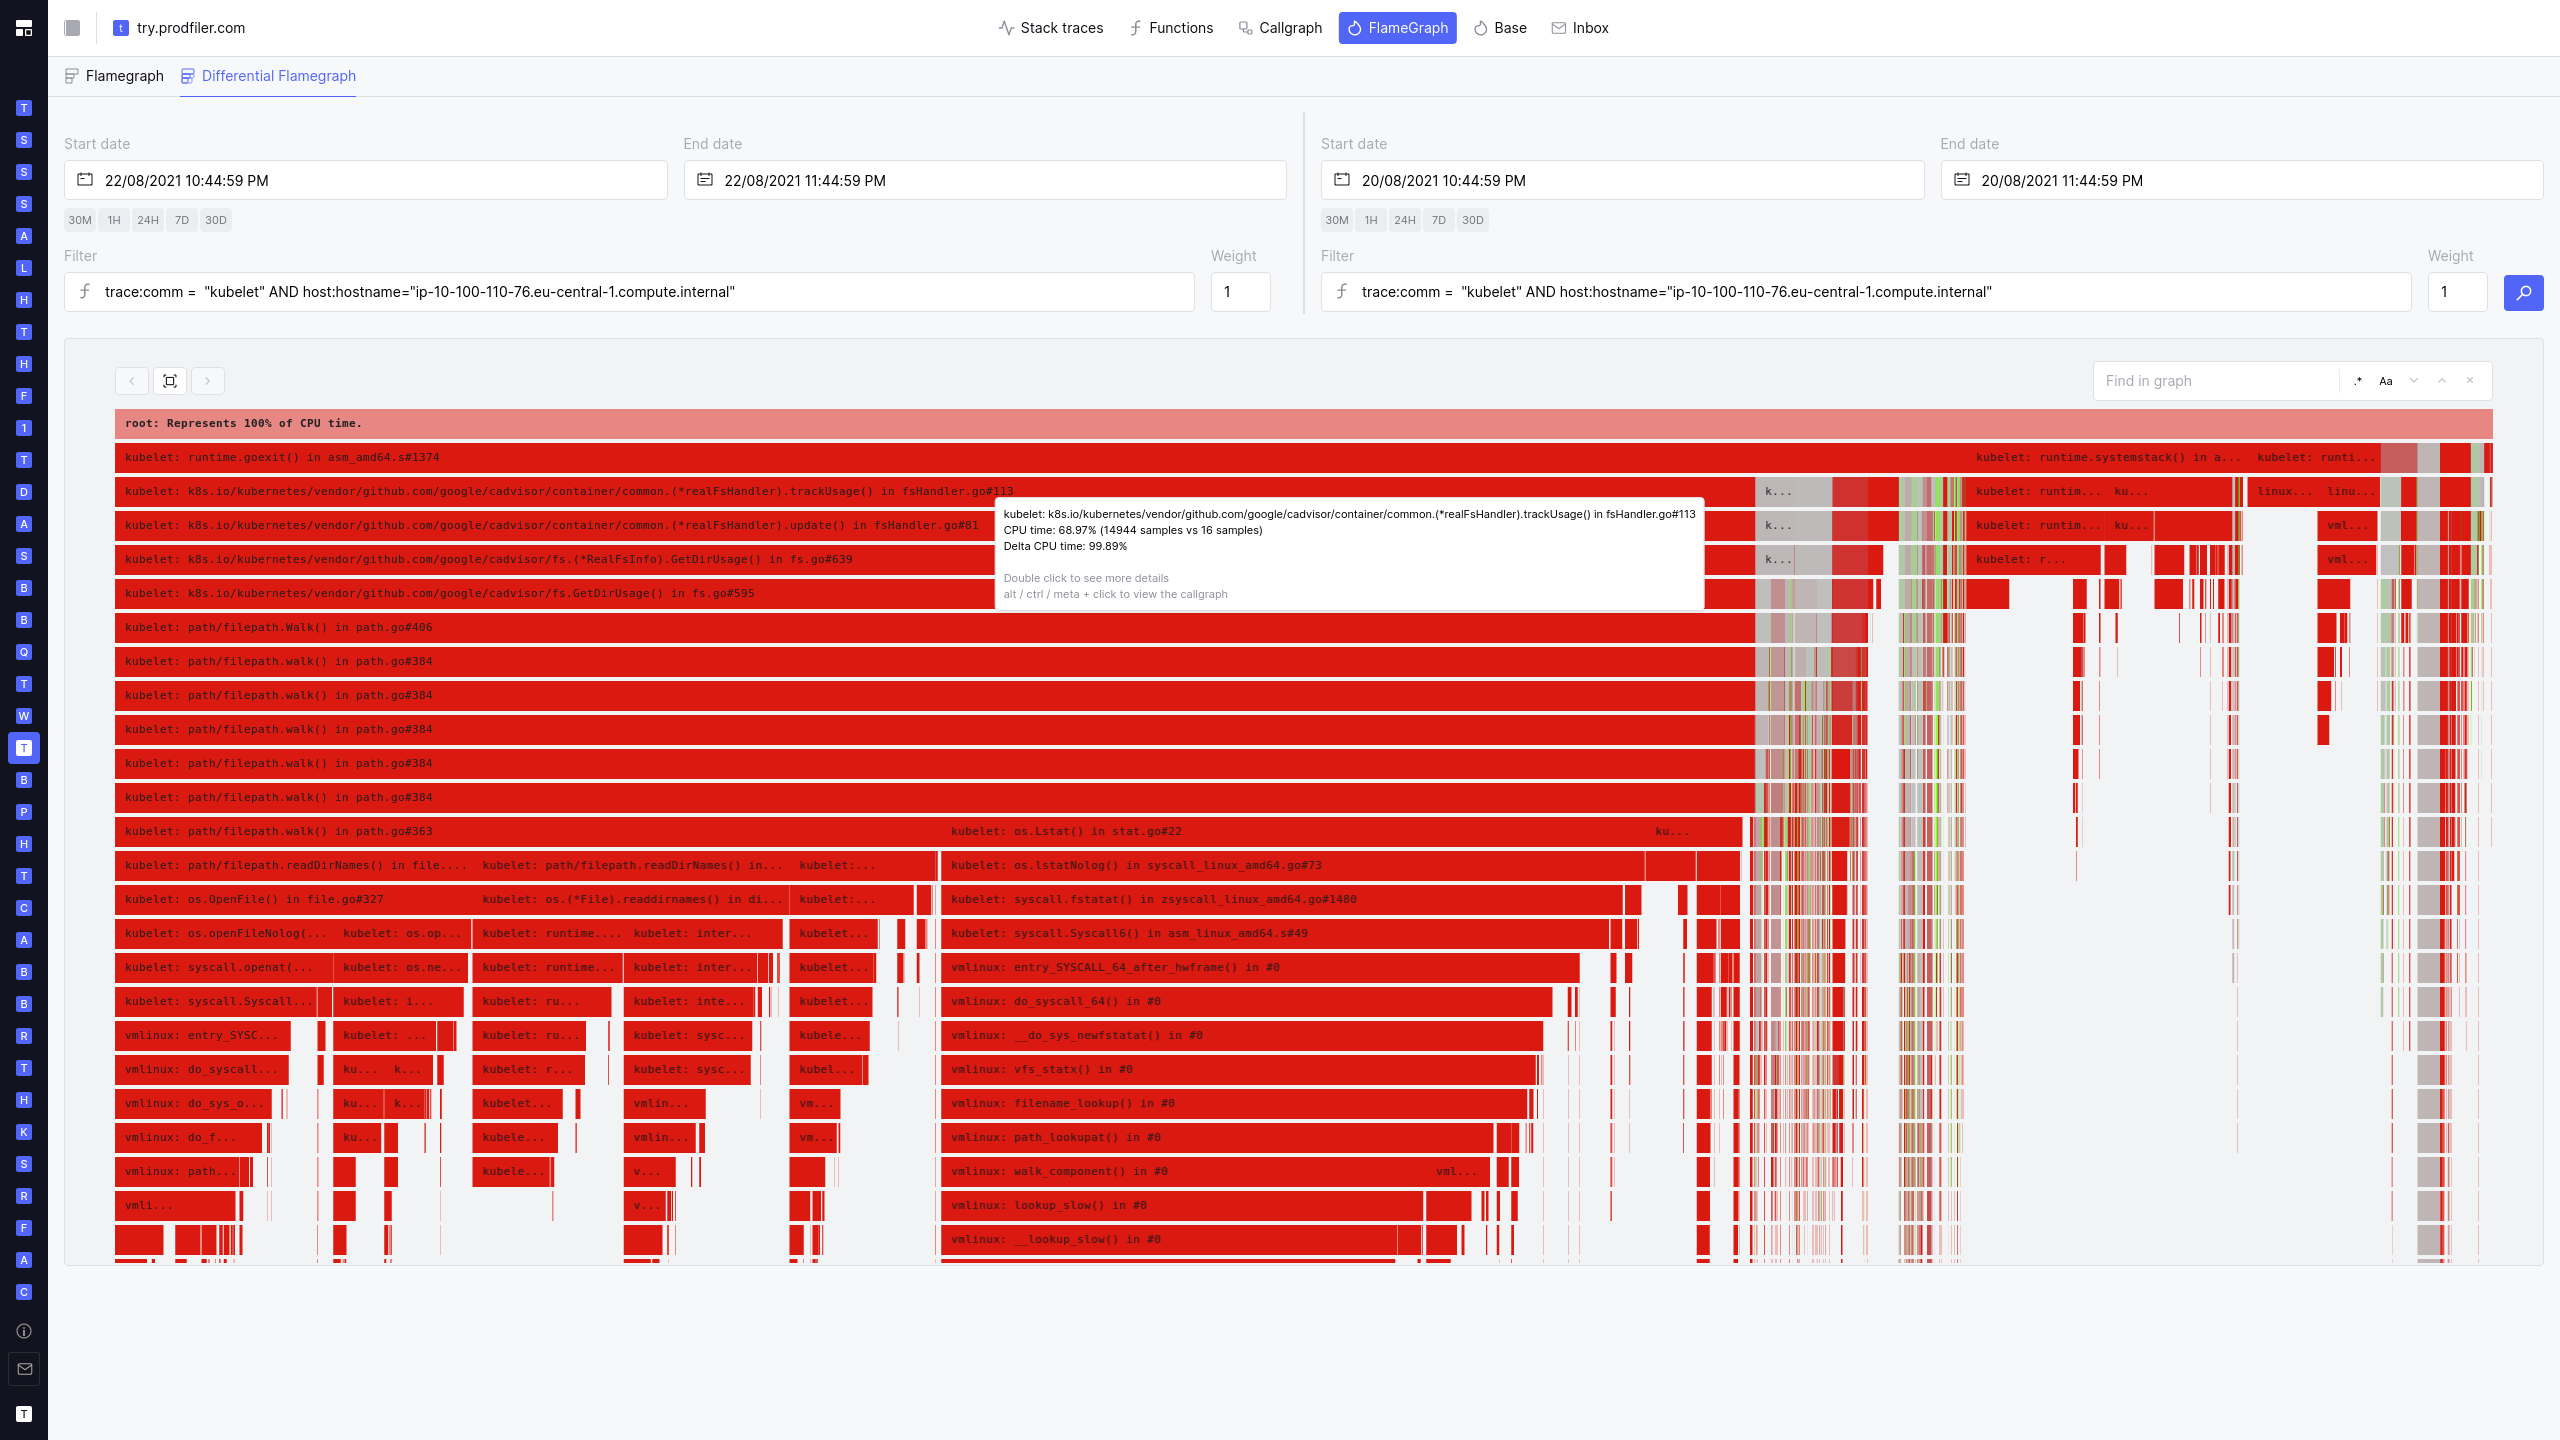
Differential flamegraph comparing `kubelet` pre- and post-jump: Grey code is unchanged in CPU consumption
In the above flamegraph, the grey areas show the parts of the code that did not have increased CPU consumption, everything in red shows increased consumption for an equivalent timeframe.
The biggest increase is in cadvisor/container/common.(*realFsHandler).trackUsage(): In the time period of one hour, we used to get ~16 samples involving this stack frame; after the jump in CPU utilization, we received almost 15k samples. Clearly something is going wrong.
Digging into the relevant source code for cadvisor, we land at this snippet:
It turns out that cadvisor, in order to track the disk usage of local containers, performs a recursive directory walk of the r/w layer of all containers every minute.
Further investigation revealed that some of the containers that were deployed would, under certain circumstances, create rather sizeable directory trees on the r/w layer – small in individual file size, but large in terms of overall filesystem tree (number of directories and number of small files).
In pessimal cases, this can lead to a triple-whammy of resource consumption:
- kubelet/cadvisor can end up eating significant CPU walking the directory tree repeatedly
- Depending on other factors, the periodic file system walk can start consuming things such as EBS credits, deteriorating the IOPS for the underlying volume.
- Performing the directory walk leads to a number of short-lived allocations which then end up creating more work for the garbage collector (in our example, the number of GC-related samples went from ~270 per hour to ~1300 per hour).
The issue is not new – in the past, cadvisor had the habit of running du on every container at regular intervals, and this issue has a pretty thorough discussion about the fix of only iterating over the r/w layer.
Now, it is not a secret that creating large numbers of files and directories in the r/w layer of containers is not a good practice (and usually easily avoided) – that said, not every developer is aware of the detrimental effects this can have outside of their own container.
Once the issue was diagnosed, it was fixed relatively easily by reducing the size and depth of the directory structure the container created on startup, and kubelet CPU (and iops) consumption reverted back to the expected norm.
If you want to reproduce the issue on your own cluster, you can use the following source code and Dockerfile:
If this blog post made you curious about continuously profiling entire Kubernetes clusters (or other large-scale deployments), visit https://run.prodfiler.com/signup and get started 🙂
Read the Full P99 CONF Agenda
To see the full breadth of speakers at P99 CONF, check out the published agenda, and register now to reserve your seat. P99 CONF will be held October 6 and 7, 2021, as a free online virtual conference. Register today to attend!