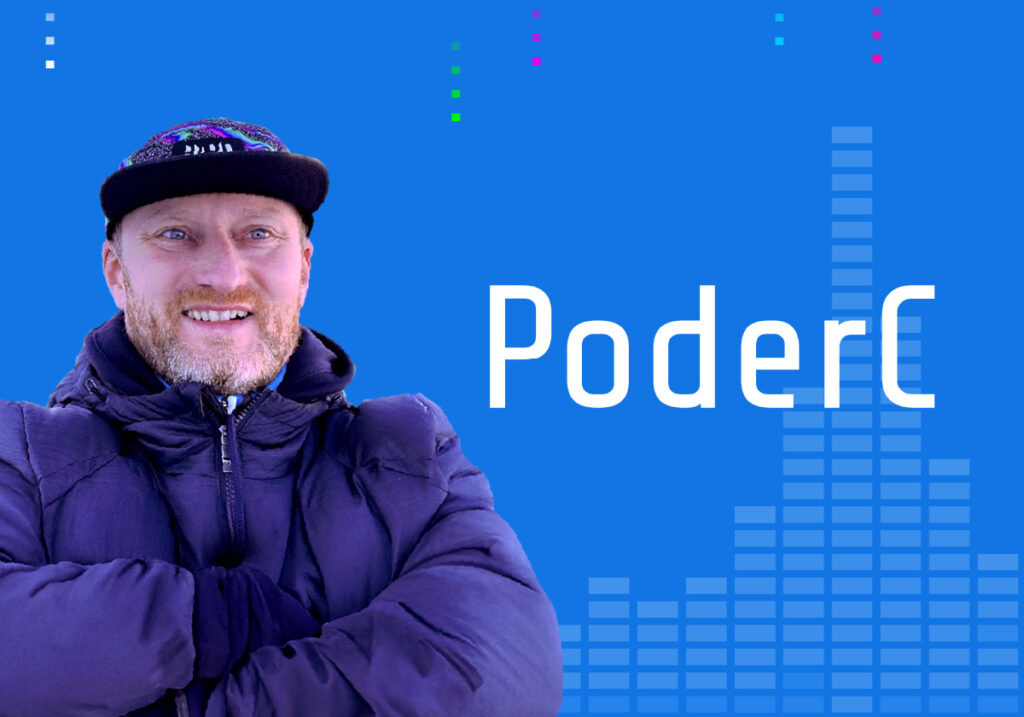
Tanel Poder, Performance Nerd at PoderC Consulting, will be presenting “Using eBPF Off-CPU Sampling to See What Your Databases are Really Waiting For” at P99 CONF 24. Tanel will show the latest eBPF-based “xcapture” tool (from the 0x.toolset which he developed) in practical use, measuring where MySQL, Postgres and DuckDB really spend their time, both when on CPU and sleeping. All this can be done without having to change any source code of the database engine or applications running on it.
Note: P99 CONF is a technical conference on performance and low-latency engineering. It’s virtual, free, and highly interactive. This year’s agenda spans Rust, Zig, Go, C++, compute/infrastructure, Linux, Kubernetes, databases, and more.
We hope you’ll join us live October 23-24 to hear the talk and chat with Tanel. In the meantime, let’s get to know a little about him!
How do you answer the dreaded “tell us about yourself” question?
I’ve held a wide range of different roles over the last 30 years, ranging from global data platform engineering to machine code reverse engineering, from technology evangelism to building startups – and everything in between. So, I’ll summarize my professional existence as being a long-time computer performance geek. Everything I’ve done is around performance, efficiency and better ways of doing things in general, including helping people to do their work better. I still get a kick out of understanding how complex systems work, so I will happily keep nerding out in the computer performance space!
What’s the most interesting project that you’re working on right now – or hoping to start soon?
I’m currently making big changes to my open source 0x.tools toolset for Linux system performance analysis with thread-level drilldown. I am using a method that I call “Extended Thread State Sampling” and have now implemented the prototype using eBPF. This approach gives you the ability to see what all threads in your system are doing (both on-CPU and off-CPU) and why they are doing that.
All this without having to trace every single event of every thread. I have already published a couple of demonstration tools (xtop, xcapture-bpf) just to show how powerful this approach can be. I believe that tracking (not tracing!) all threads’ activity, combined with periodic sampling of these tracked thread states, should be the standard starting point for system performance troubleshooting & drilldown. Just like running top, but with X-Ray vision. 🙂
And people already get the idea – despite having only prototyped under 5% of the final vision, the 0x.tools GitHub repo has already over 1.3k stars!
What will you be talking about at P99 CONF?
I will apply the extended thread state sampling (eTSS) method on a few common relational database engines like Postgres, MySQL/MariaDB and DuckDB, to show examples of practical applications of this new approach. You will no longer have to beg your vendor or OSS maintainer to add missing “wait events” or additional metrics to their software – with eTSS you can bring your own instrumentation!
What other P99 CONF talks are you most looking forward to – and why?
I am very interested in understanding patterns of problems and system behavior, plus any models or general approaches invented for addressing them in a methodical way.
So here’s my list of talks that I’ll definitely attend:
- Queues, Hockey Sticks and Performance by David Collier-Brown
- Designing a Query Queue for ScyllaDB by Avi Kivity
- Patterns of Low Latency by Pekka Enberg
And of course, I’ll check out what Andy Pavlo and Michael Stonebraker have to say!
What do you like most about P99 CONF?
P99 CONF talks go straight to the point from the systematic understanding angle that I like, delivered by people who are deep in the trenches, living that life. It’s not a vendor best practices conference that proposes a checklist of “easy answers” that may be simple to try, but are nevertheless trial-and-error approaches that might not work for you, or even work against you.
Any performance-related resource recommendations for the P99 CONF community?
Marc Brooker’s blog on distributed systems & data stores, practical algorithms, etc
- I find Marc’s range of topics and the angle/detail level in them exactly what I’m looking for (it’s one of the very few blogs that I regularly read these days)
- https://brooker.co.za/blog/
Andrii Nakryiko’s eBPF blog
- I found Andrii’s eBPF articles refreshing and exactly to the point of what I needed, when I started my transition from being a “bpftrace script kiddy” to a more serious eBPF programmer (I still have a long way to go though! 🙂)
- https://nakryiko.com/
How to Make Things Faster by Cary Millsap (also a speaker at this conference)
- This book is not about any specific OS, platform or a performance tool – but rather a collection of very clearly written stories and approaches for thinking about performance
- https://method-r.com/
And of course if you’d like to read my various database & system performance articles, check out my blog:


